Access annual and quarterly data on global iPhone shipments and market share starting from 2007.
Published Date: Mar 7, 2024
| Quarter | Q4 2021 | Q1 2022 | Q2 2022 | Q3 2022 | Q4 2022 | Q1 2023 | Q2 2023 | Q3 2023 | Q4 2023 |
|---|---|---|---|---|---|---|---|---|---|
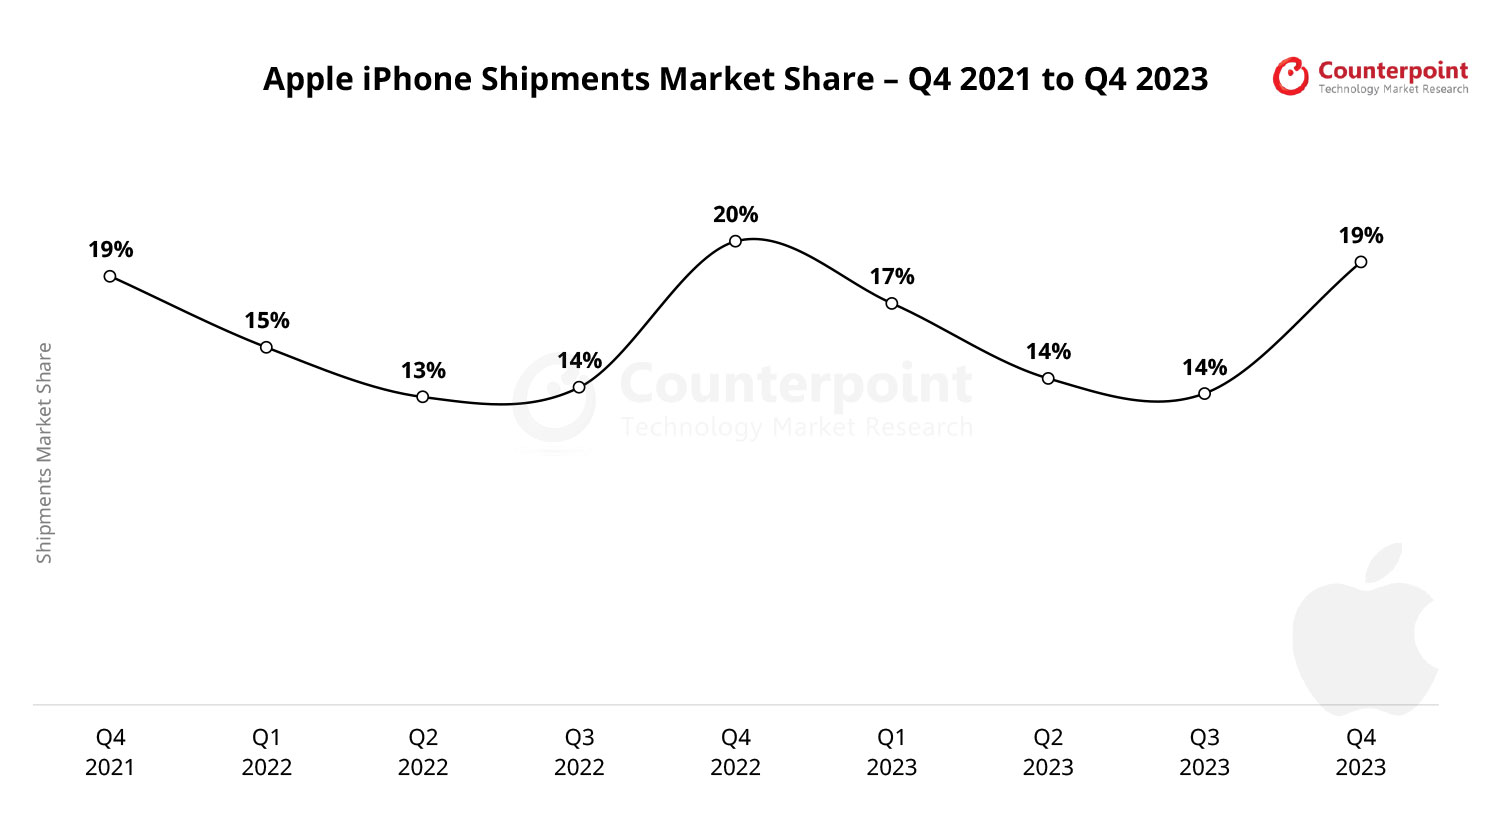
| Shipments Market Share (in %) | 19% | 15% | 13% | 14% | 20% | 17% | 14% | 14% | 19% |
| Quarter | Q4 2021 | Q1 2022 | Q2 2022 | Q3 2022 | Q4 2022 | Q1 2023 | Q2 2023 | Q3 2023 | Q4 2023 |
|---|---|---|---|---|---|---|---|---|---|
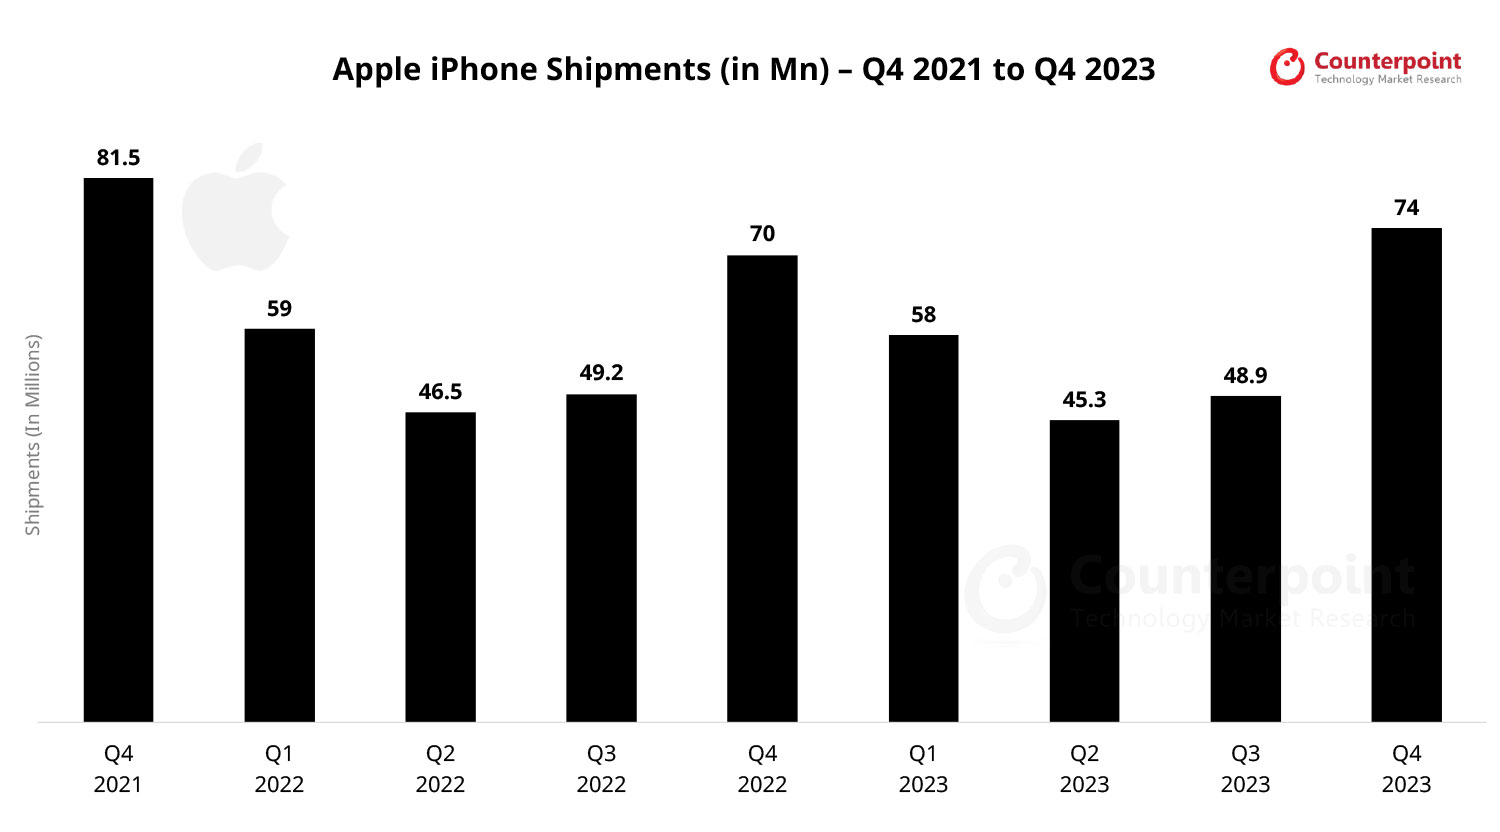
| Shipments (in Mn) | 81.5 | 59 | 46.5 | 49.2 | 70 | 58 | 45.3 | 48.9 | 74 |
| Quarter | Q4 2021 | Q1 2022 | Q2 2022 | Q3 2022 | Q4 2022 | Q1 2023 | Q2 2023 | Q3 2023 | Q4 2023 |
|---|---|---|---|---|---|---|---|---|---|
| Shipments Market Share (in %) | 19% | 15% | 13% | 14% | 20% | 17% | 14% | 14% | 19% |
| Quarter | Q4 2021 | Q1 2022 | Q2 2022 | Q3 2022 | Q4 2022 | Q1 2023 | Q2 2023 | Q3 2023 | Q4 2023 |
|---|---|---|---|---|---|---|---|---|---|
| Shipments (in Mn) | 81.5 | 59 | 46.5 | 49.2 | 70 | 58 | 45.3 | 48.9 | 74 |
• Apple took the top spot globally, with smartphone shipments growing by 51% QoQ and by 2% YoY, to reach 74 million units in Q4 2023.
• Apple captured 61% market in the US and 20% in China, becoming the top smartphone vendor in both these countries.
Receive quarterly updates in your email
| Year | 2007 | 2008 | 2009 | 2010 | 2011 | 2012 | 2013 | 2014 | 2015 | 2016 | 2017 | 2018 | 2019 | 2020 | 2021 | 2022 | 2023 |
|---|---|---|---|---|---|---|---|---|---|---|---|---|---|---|---|---|---|
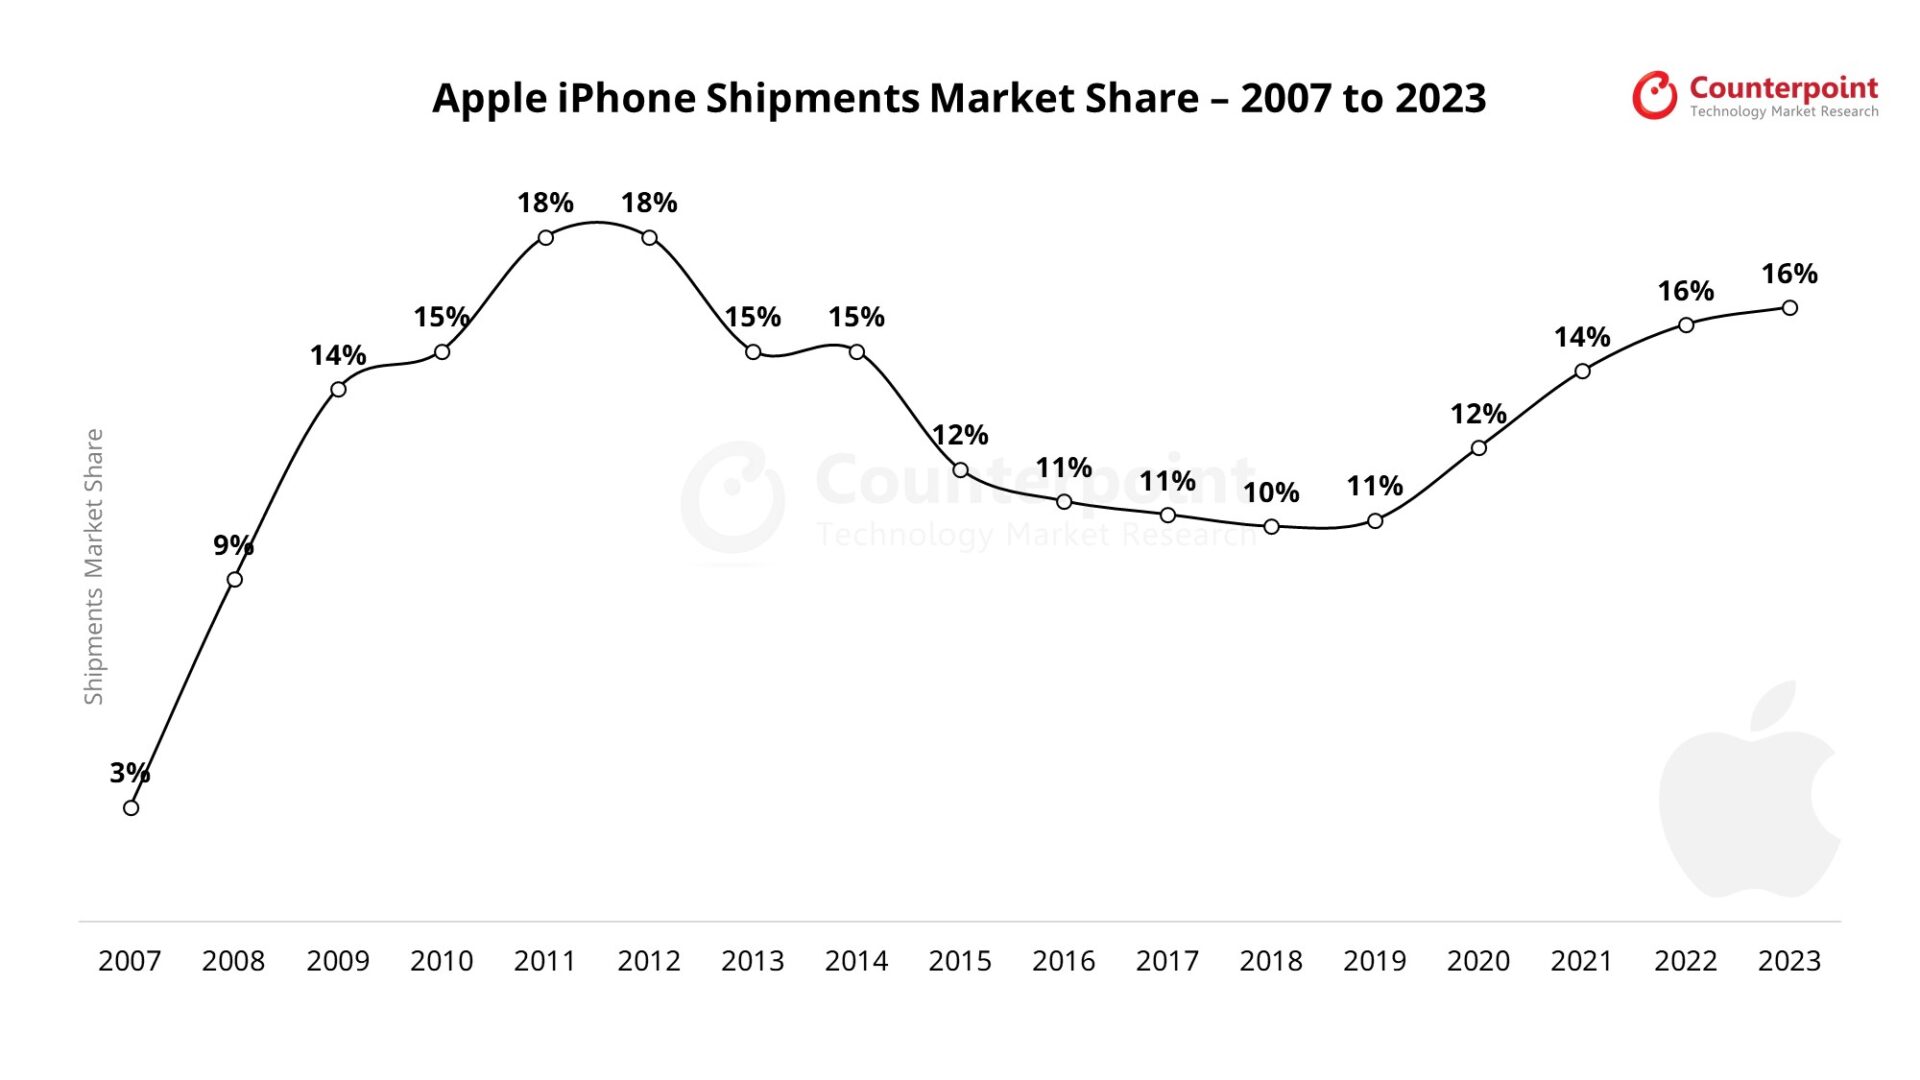
| Market Share | 3% | 9% | 14% | 15% | 18% | 18% | 15% | 15% | 12% | 11% | 11% | 10% | 11% | 12% | 14% | 16% | 16% |
| Year | 2007 | 2008 | 2009 | 2010 | 2011 | 2012 | 2013 | 2014 | 2015 | 2016 | 2017 | 2018 | 2019 | 2020 | 2021 | 2022 | 2023 |
|---|---|---|---|---|---|---|---|---|---|---|---|---|---|---|---|---|---|
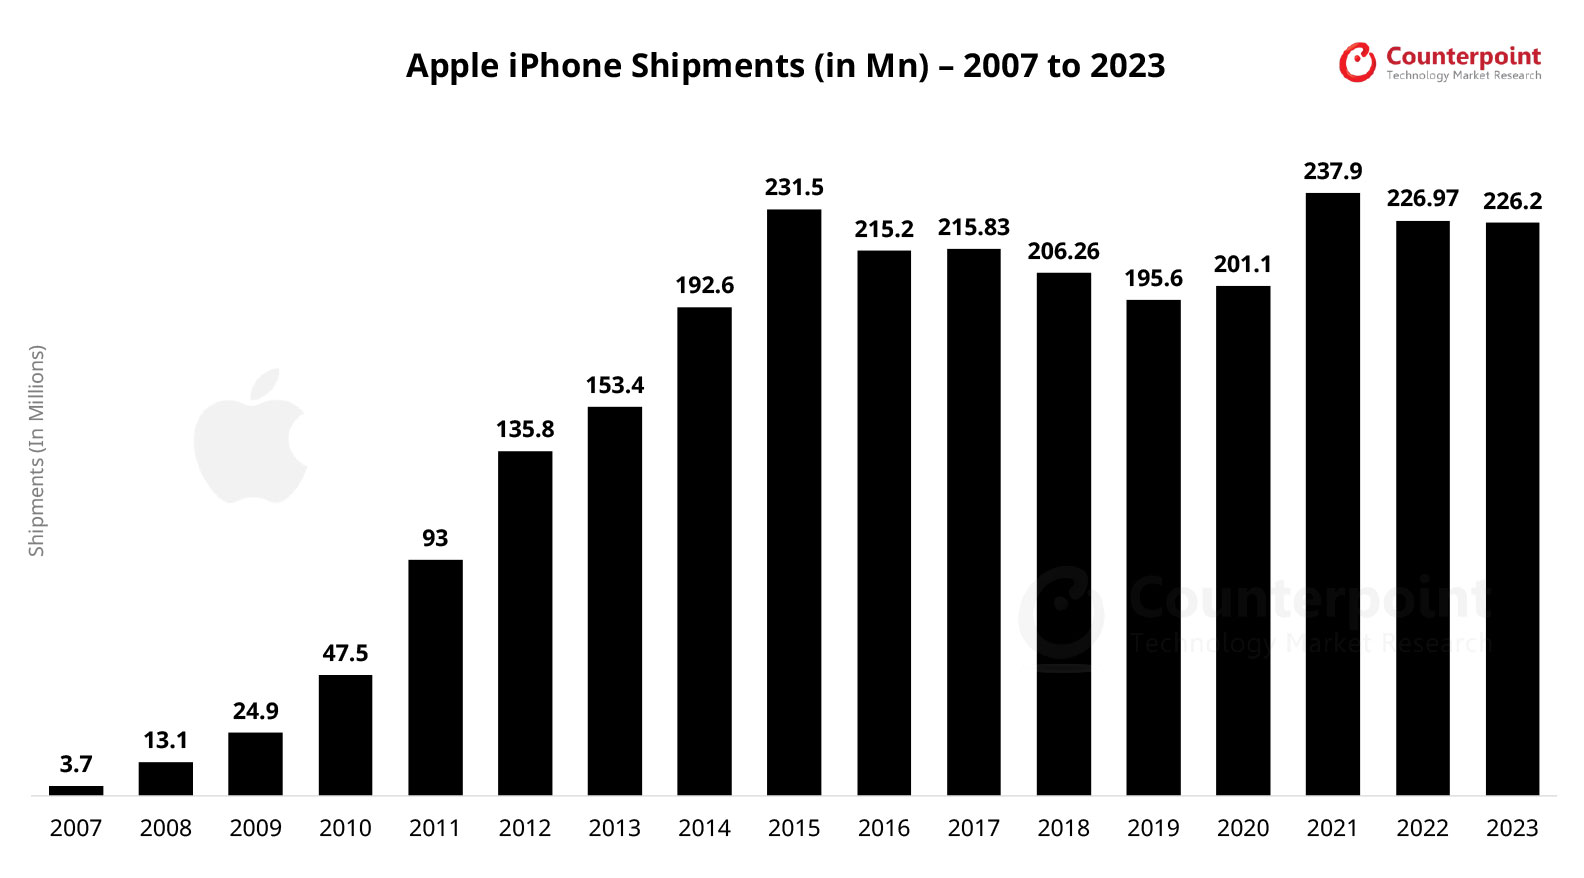
| Shipments (in Mn) | 3.7 | 13.1 | 24.9 | 47.5 | 93 | 135.8 | 153.4 | 192.6 | 231.5 | 215.2 | 215.8 | 206.3 | 195.6 | 201.1 | 237.9 | 227 | 226.2 |
| Year | 2007 | 2008 | 2009 | 2010 | 2011 | 2012 | 2013 | 2014 | 2015 | 2016 | 2017 | 2018 | 2019 | 2020 | 2021 | 2022 | 2023 |
|---|---|---|---|---|---|---|---|---|---|---|---|---|---|---|---|---|---|
| Market Share | 3% | 9% | 14% | 15% | 18% | 18% | 15% | 15% | 12% | 11% | 11% | 10% | 11% | 12% | 14% | 16% | 16% |
| Year | 2007 | 2008 | 2009 | 2010 | 2011 | 2012 | 2013 | 2014 | 2015 | 2016 | 2017 | 2018 | 2019 | 2020 | 2021 | 2022 | 2023 |
|---|---|---|---|---|---|---|---|---|---|---|---|---|---|---|---|---|---|
| Shipments (in Mn) | 3.7 | 13.1 | 24.9 | 47.5 | 93 | 135.8 | 153.4 | 192.6 | 231.5 | 215.2 | 215.8 | 206.3 | 195.6 | 201.1 | 237.9 | 227 | 226.2 |

The global iPhone market share numbers are from:
Excel File
Published Date: March 2024
Counterpoint Research uniquely tracks both sell-in and sell-through of mobile handsets in the market, giving a broader perspective of the market dynamics. This report covers quarterly sell-in vs sell-through of Apple iPhone models along with average selling price (ASP). The report provides global iPhone shipment and sales by quarter helping clients to understand the demand/supply scenario for the individual models.
Recommended Reads:
Copyright ⓒ Counterpoint Technology Market Research | All rights reserved