Access quarterly data and market insights showcasing India’s smartphone market share, spanning from Q1 2018.
Published Date: Feb 1, 2023
Market Highlights
• India’s smartphone shipments grew by 25% YoY in Q4 2023 (October-December).
• With an 18% share, Xiaomi regained the top spot for the first time after Q3 2022.
• vivo maintained the second spot in Q4 and led the affordable premium segment (INR 30,000-INR 45,000).
• 5G contribution reached 61% due to various 5G launches in the INR 10,000-INR 15,000 segment. Within 5G shipments, the INR 10,000-INR 15,000 price band contributed the highest at 24%.
• The ultra-premium segment (>INR 45,000) grew by 51%, with Apple leading the segment with a 71% share.
• Among the top five brands, realme was the fastest-growing brand with a 69% YoY increase.
Click here to read about India smartphone market in Q4 2023.
| Brands | Q3 2022 | Q4 2022 | Q1 2023 | Q2 2023 | Q3 2023 | Q4 2023 |
|---|---|---|---|---|---|---|
| Xiaomi | 21% | 18% | 16% | 15% | 17% | 18% |
| vivo | 14% | 18% | 17% | 17% | 16% | 17% |
| Samsung | 19% | 20% | 20% | 18% | 17% | 17% |
| realme | 14% | 8% | 9% | 12% | 14% | 11% |
| OPPO | 10% | 11% | 12% | 11% | 10% | 10% |
| Others | 22% | 25% | 26% | 27% | 26% | 27% |
*Ranking is according to the latest quarter.
#A repository of quarterly data for the India smartphone market share. Data on this page is updated every quarter.
This data is a part of a series of reports which track the mobile handset market: Smartphone and Feature Phone shipments every quarter for more than 140 brands covering more than 95% of the total device shipments in the industry.
For detailed insights on the data, please reach out to us at sales(at)counterpointresearch.com. If you are a member of the press, please contact us at press(at)counterpointresearch.com for any media enquiries.
The global smartphone market share numbers are from:
Excel File
Published Date: November 2023
This report is part of a series of reports which track the mobile handset market: Smartphone and Feature Phone shipments every quarter for more than 140 brands covering more than 95% of the total device shipments in the industry.
The global smartphone market share numbers are from:
Excel File
PDF File
This report is part of a series of reports which track the mobile handset market: Smartphone and Feature Phone shipments every quarter for more than 140 brands covering more than 95% of the total device shipments in the industry.
Recommended Reads:
Published Date: Nov 10, 2023
Market Highlights
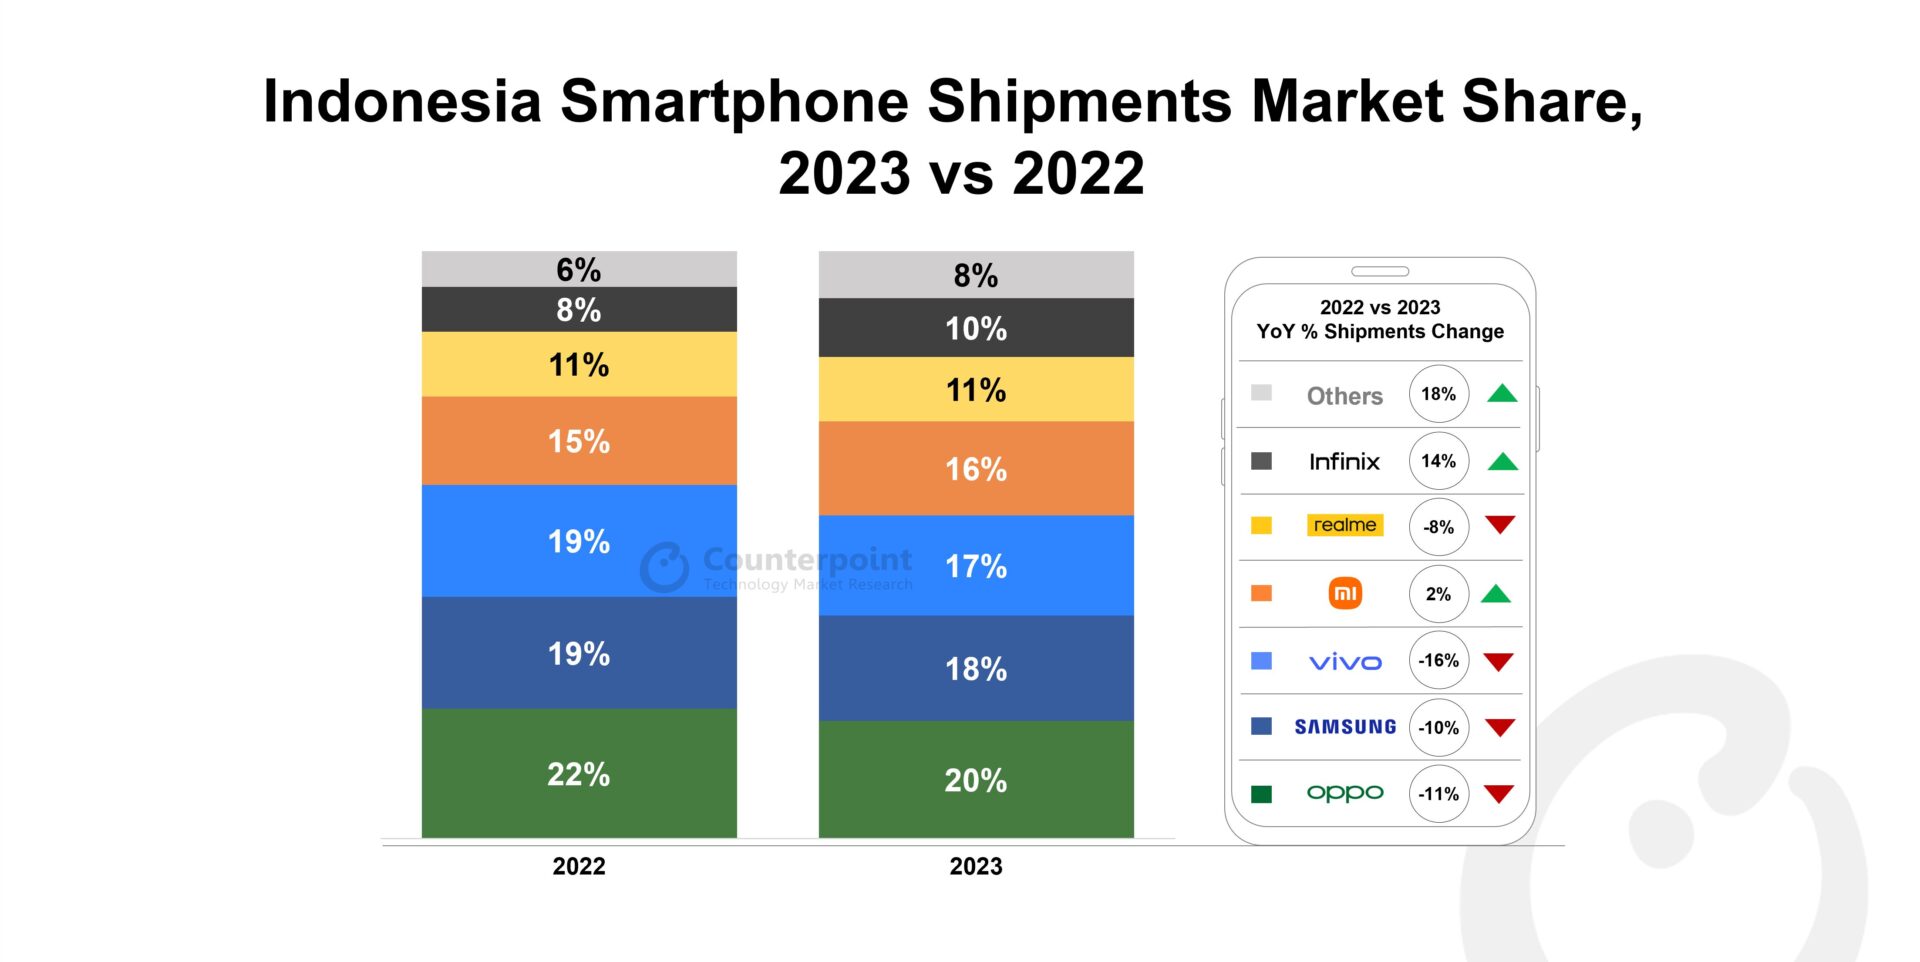
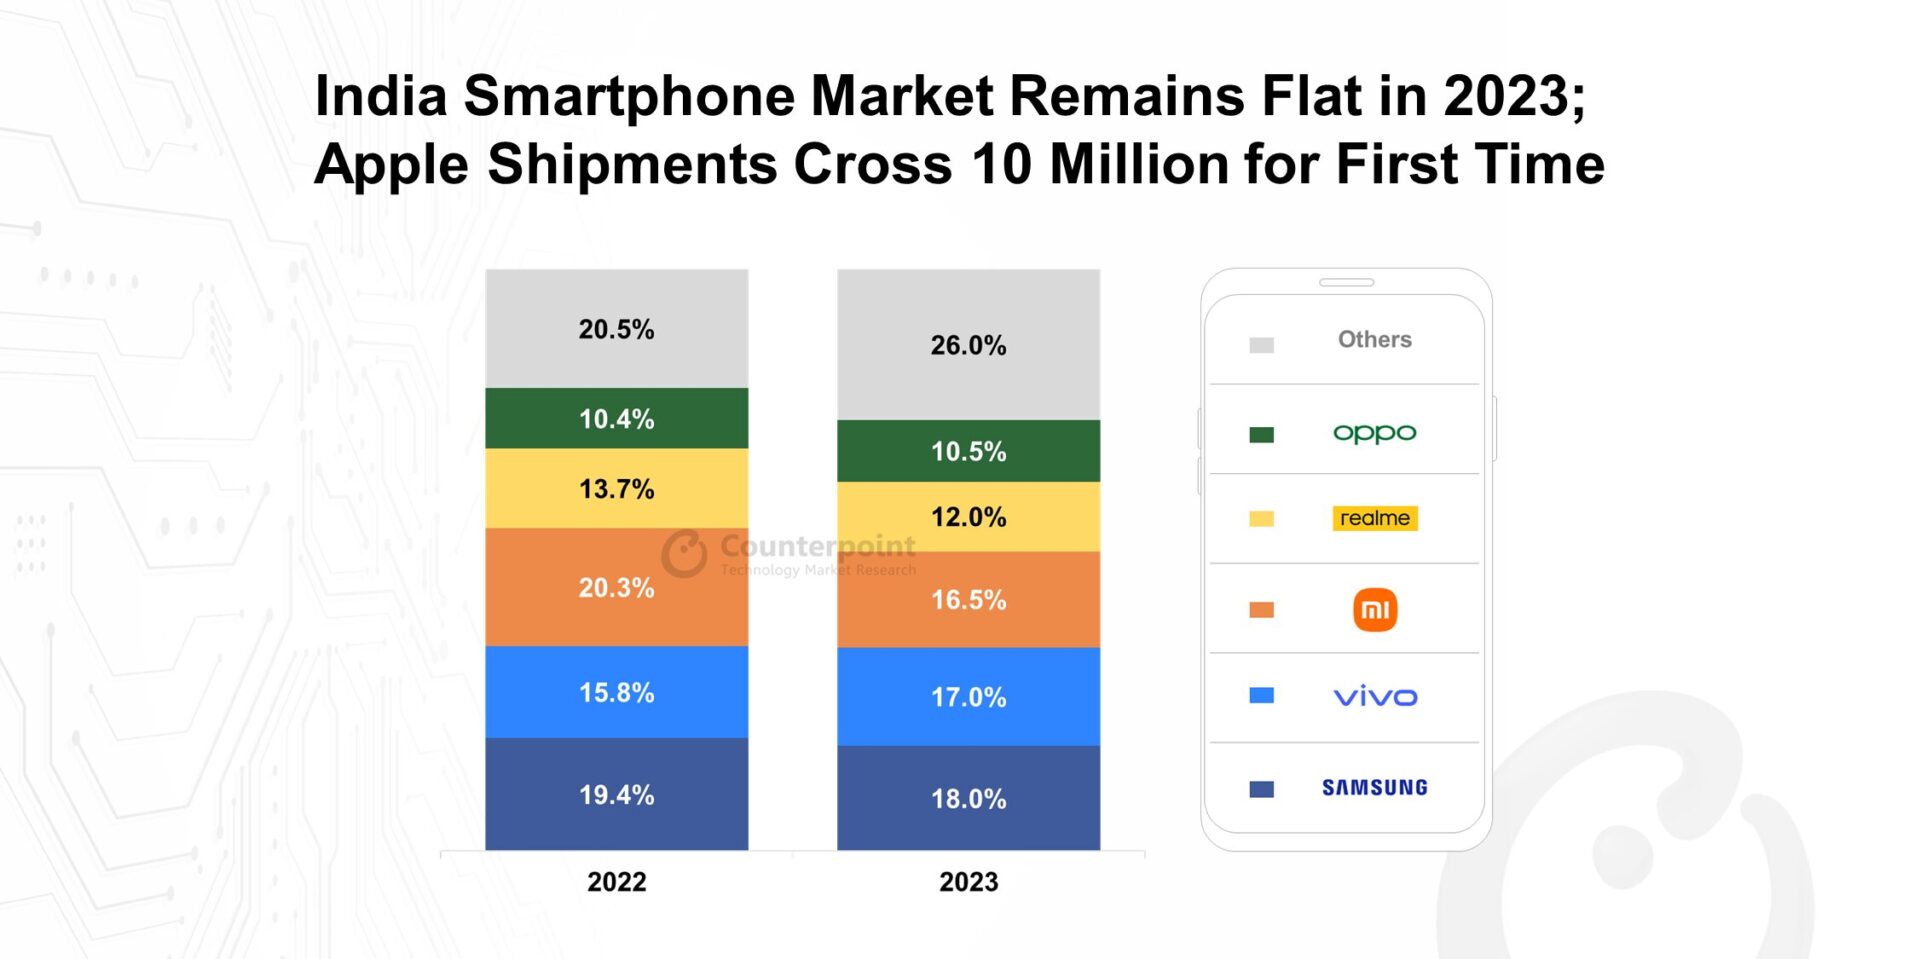
• India’s smartphone shipments remained flat in Q3 2023 (July-September) even as Apple recorded its highest ever quarterly shipments during the period.
• In Q3 2023, the share of 5G smartphone shipments reached 53%. The main growth driver was OEMs pushing multiple launches in the INR 10,000-INR 15,000 (~$120-$180) segment.
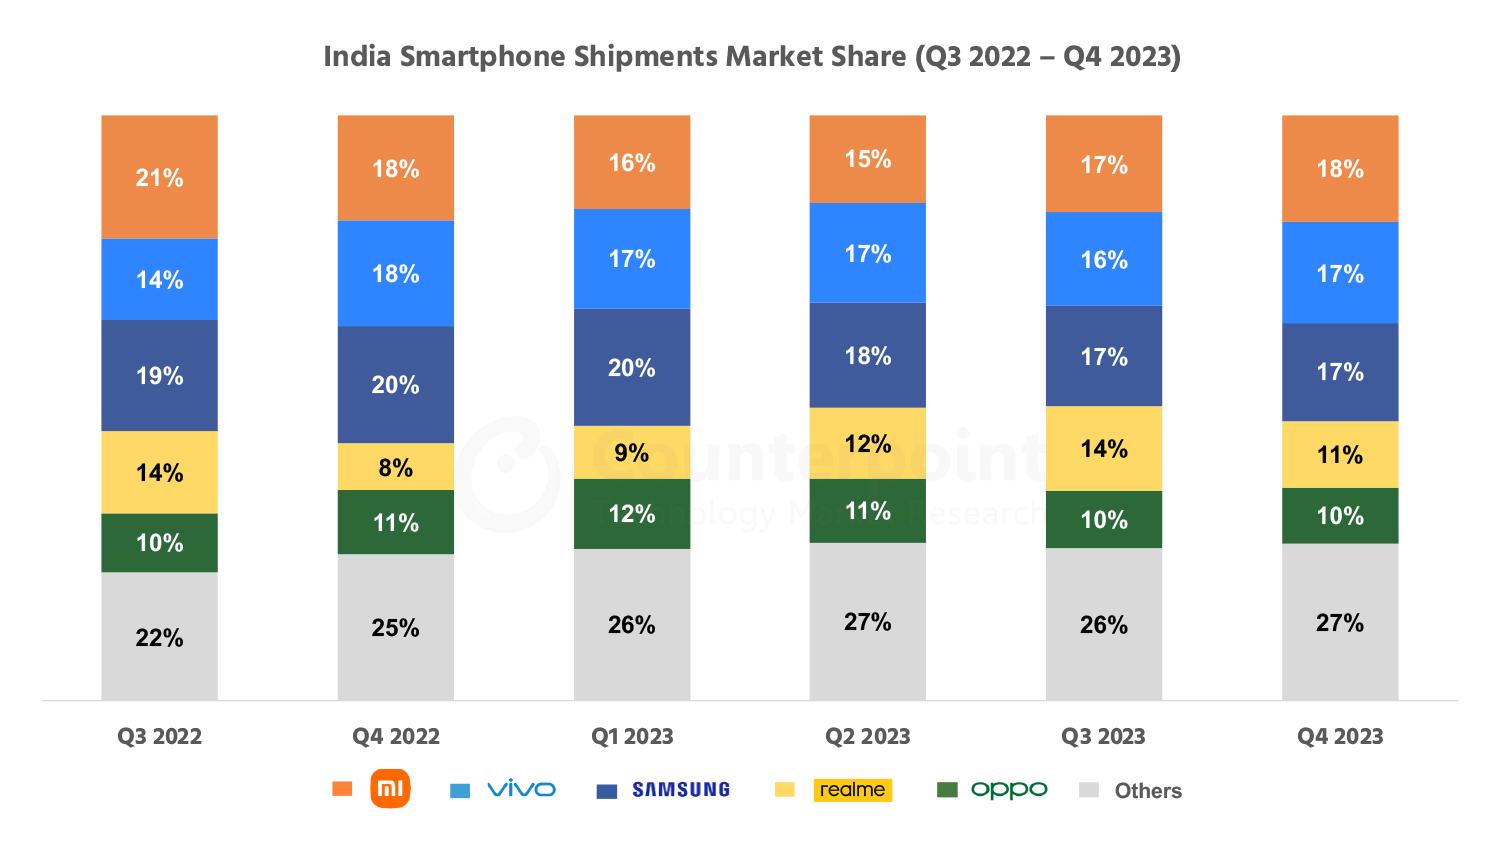
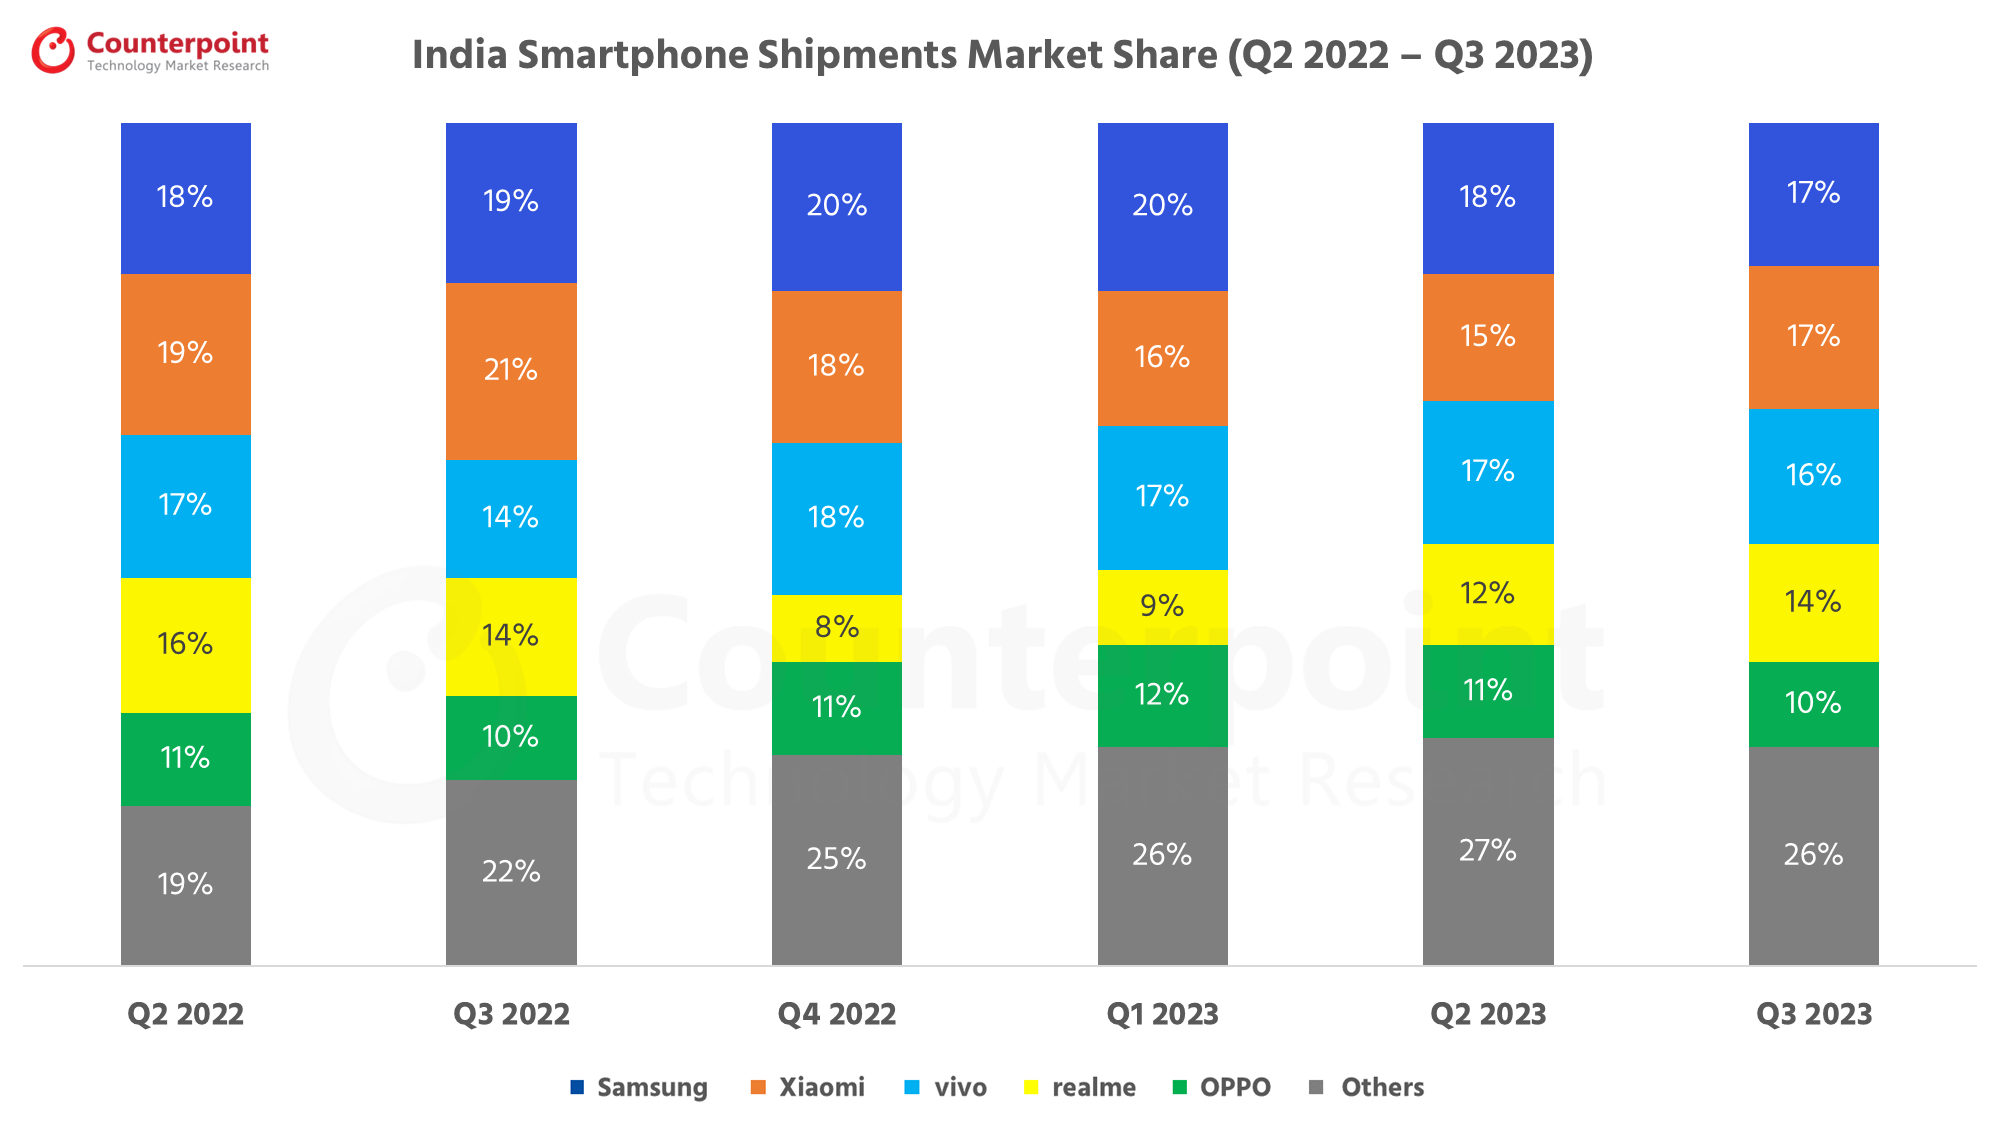
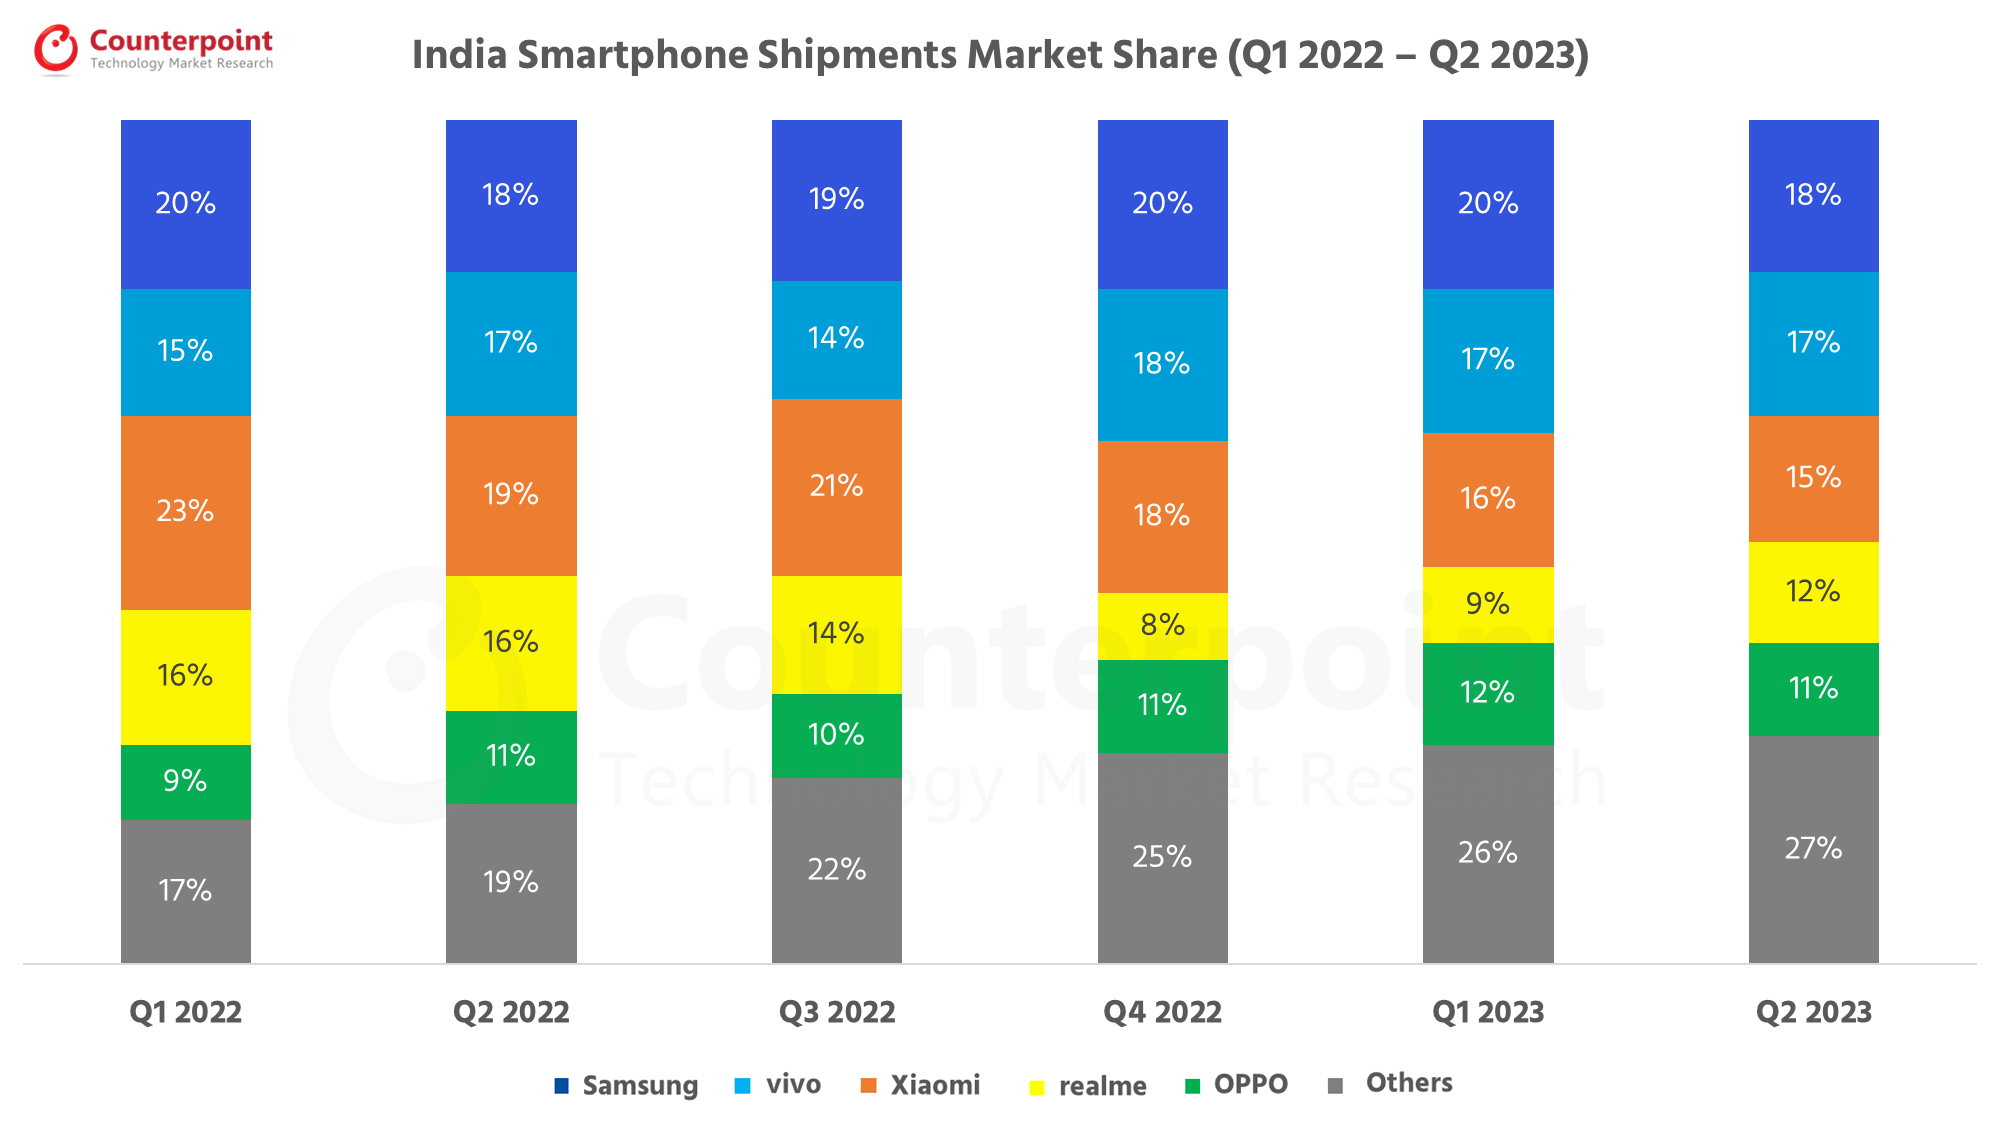
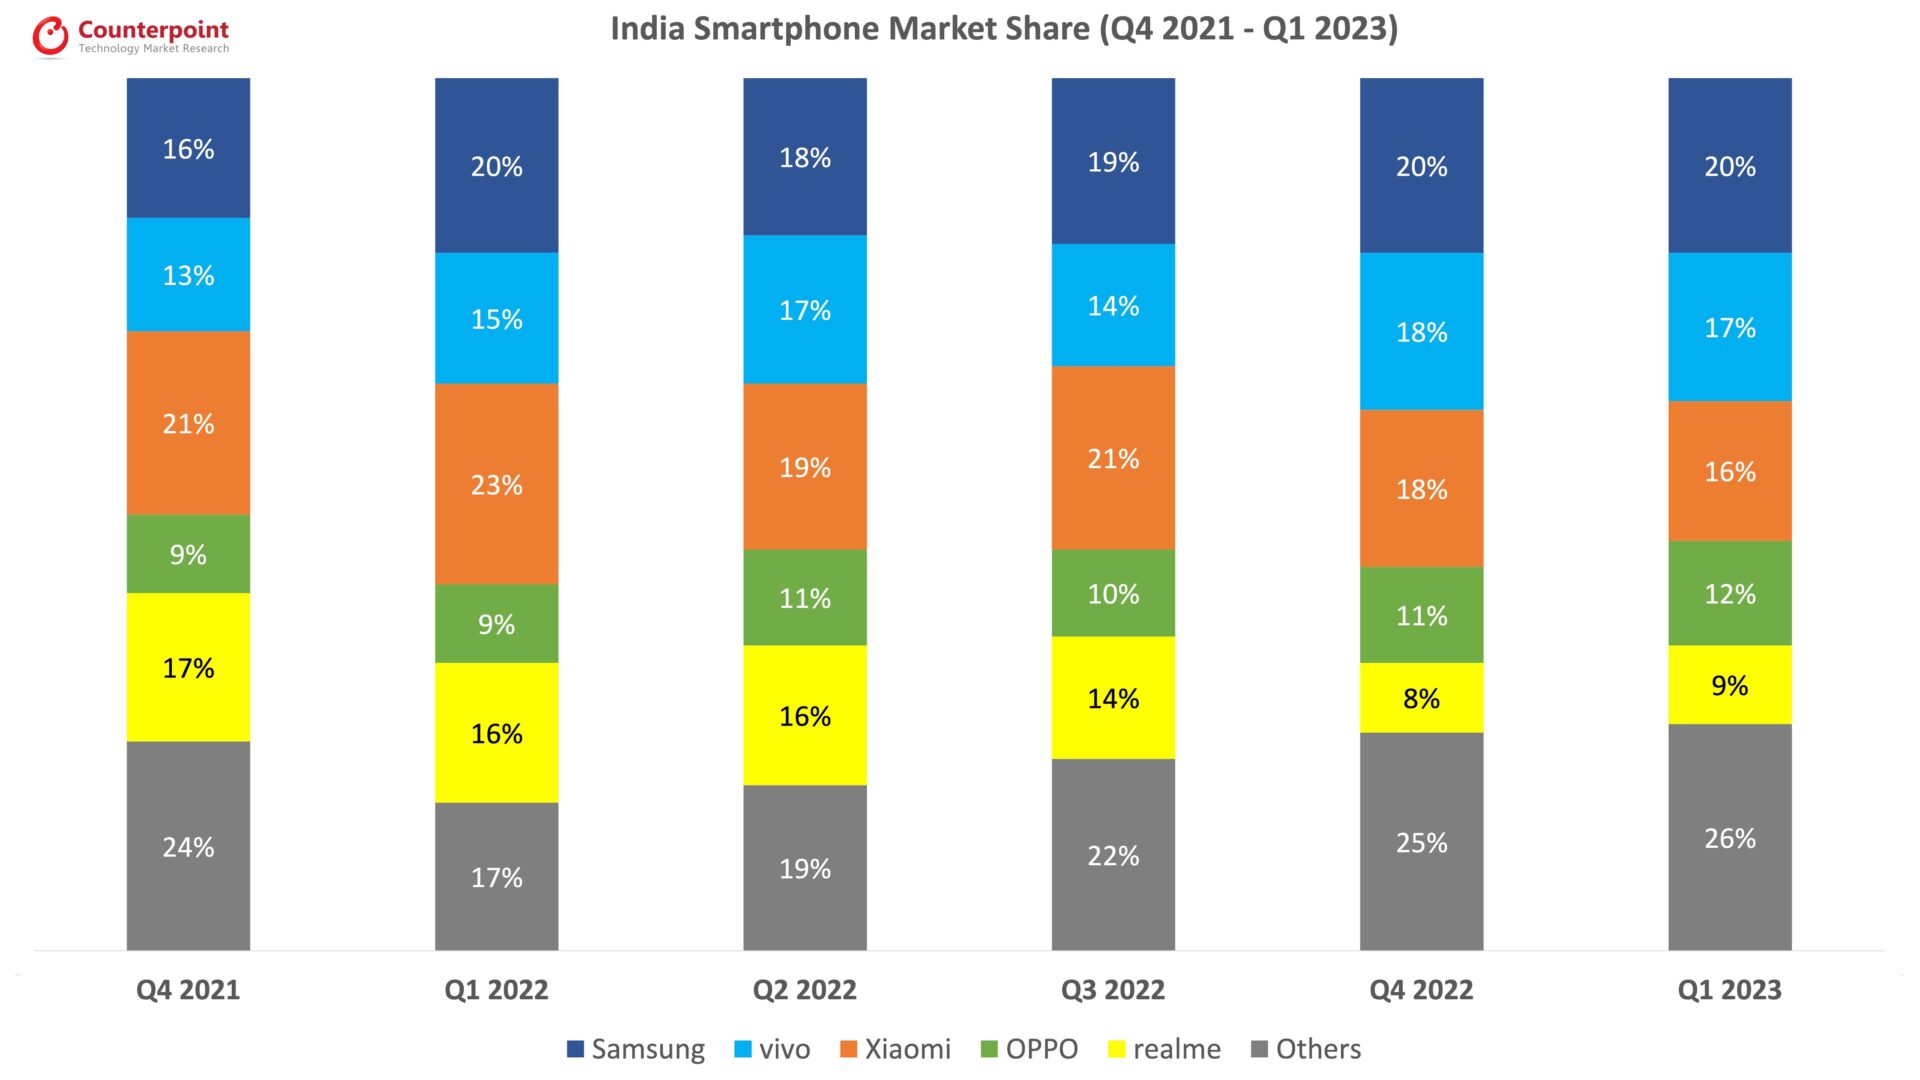
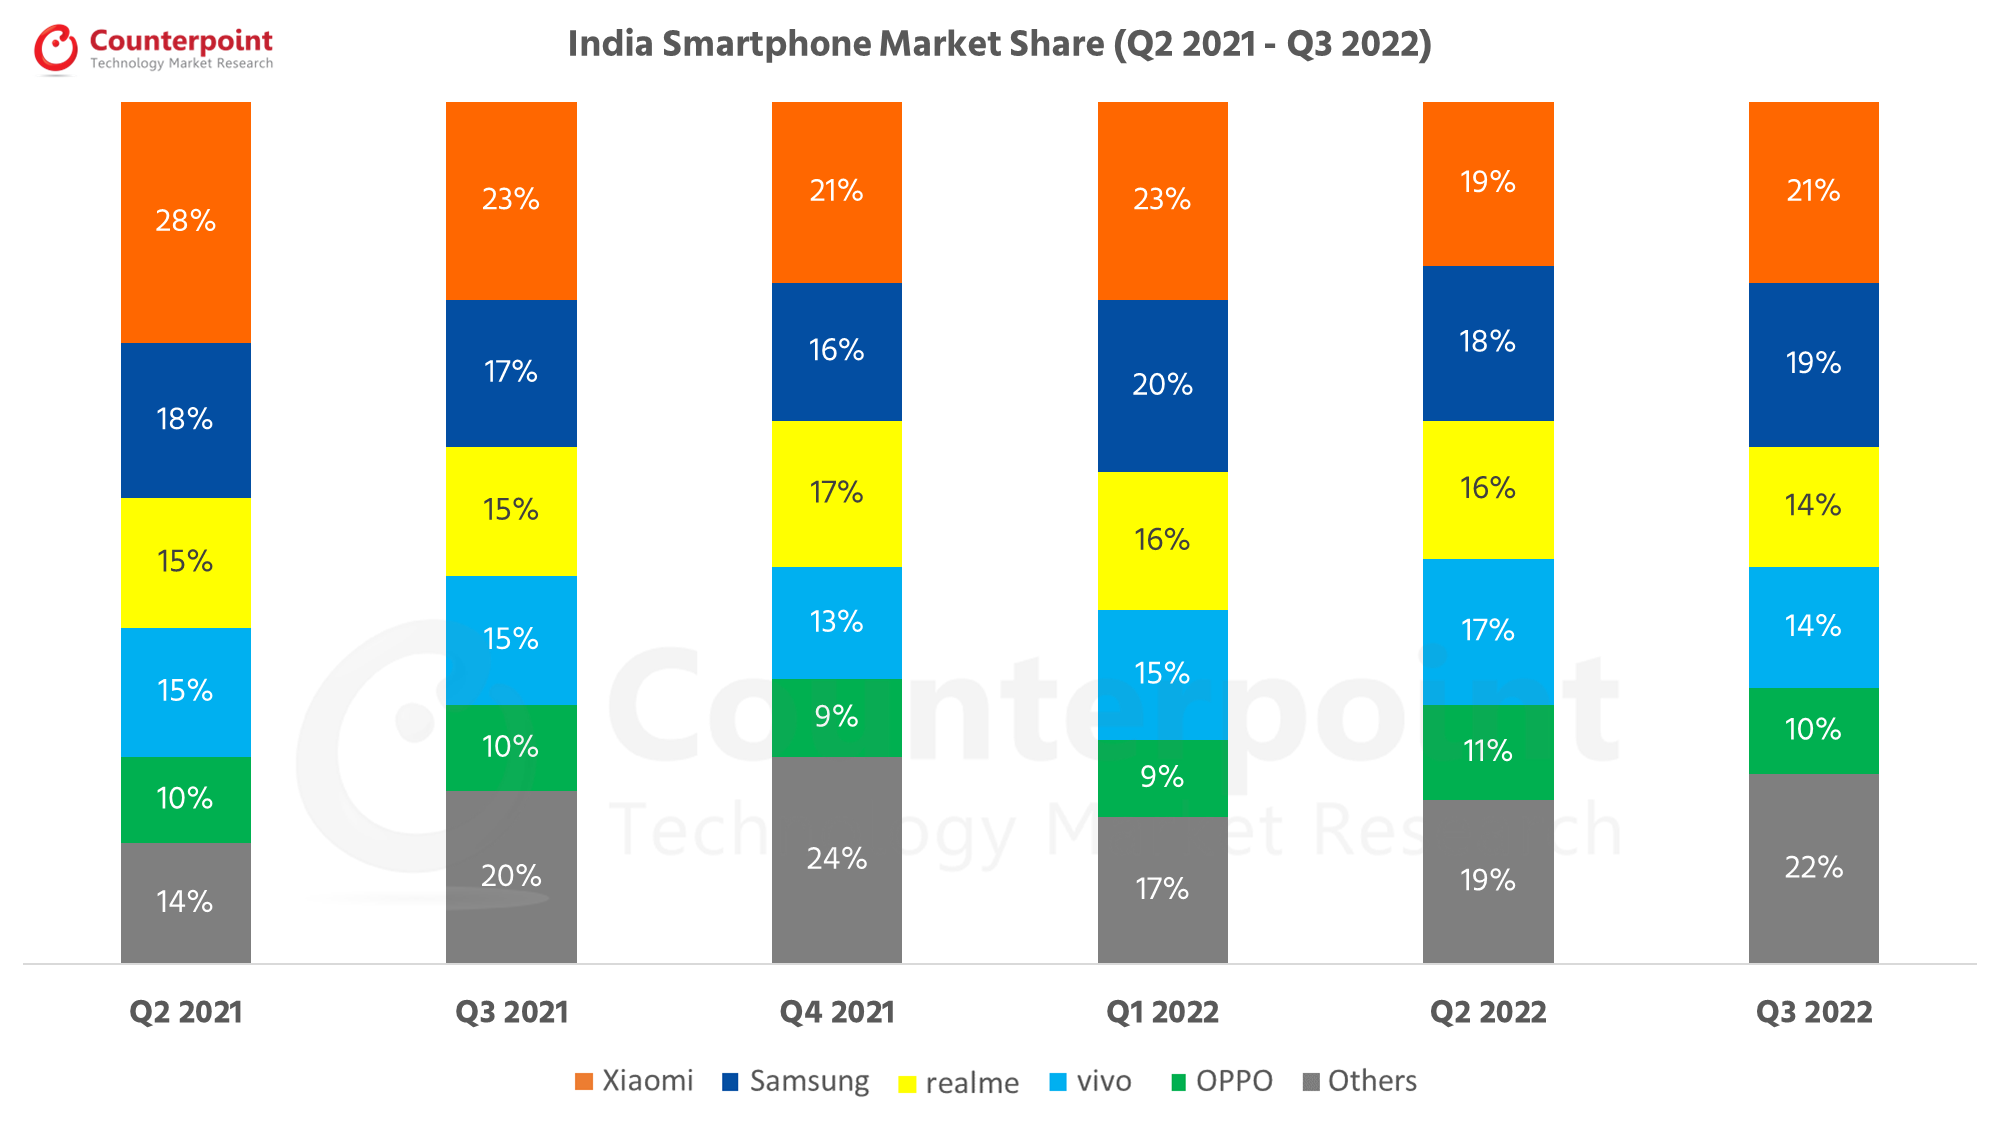
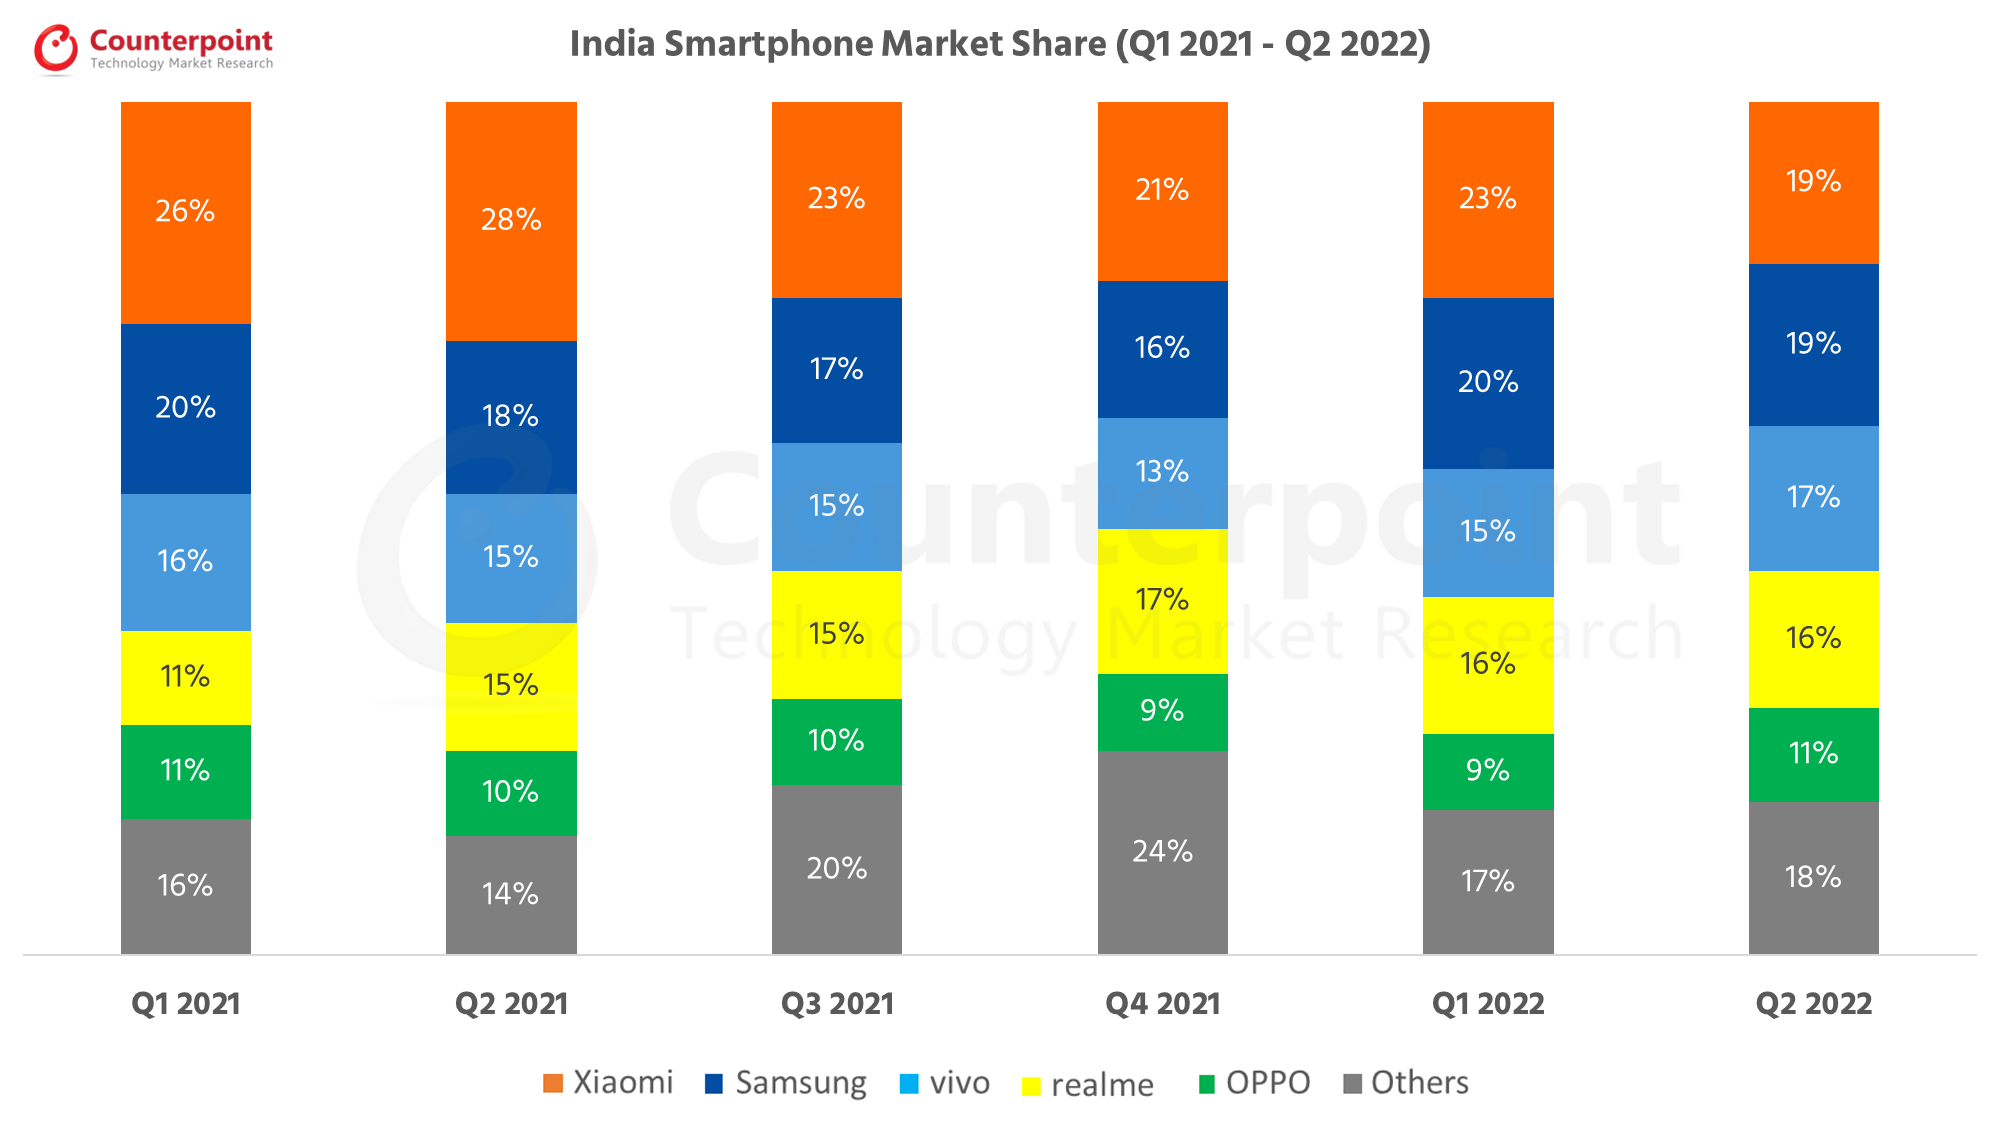
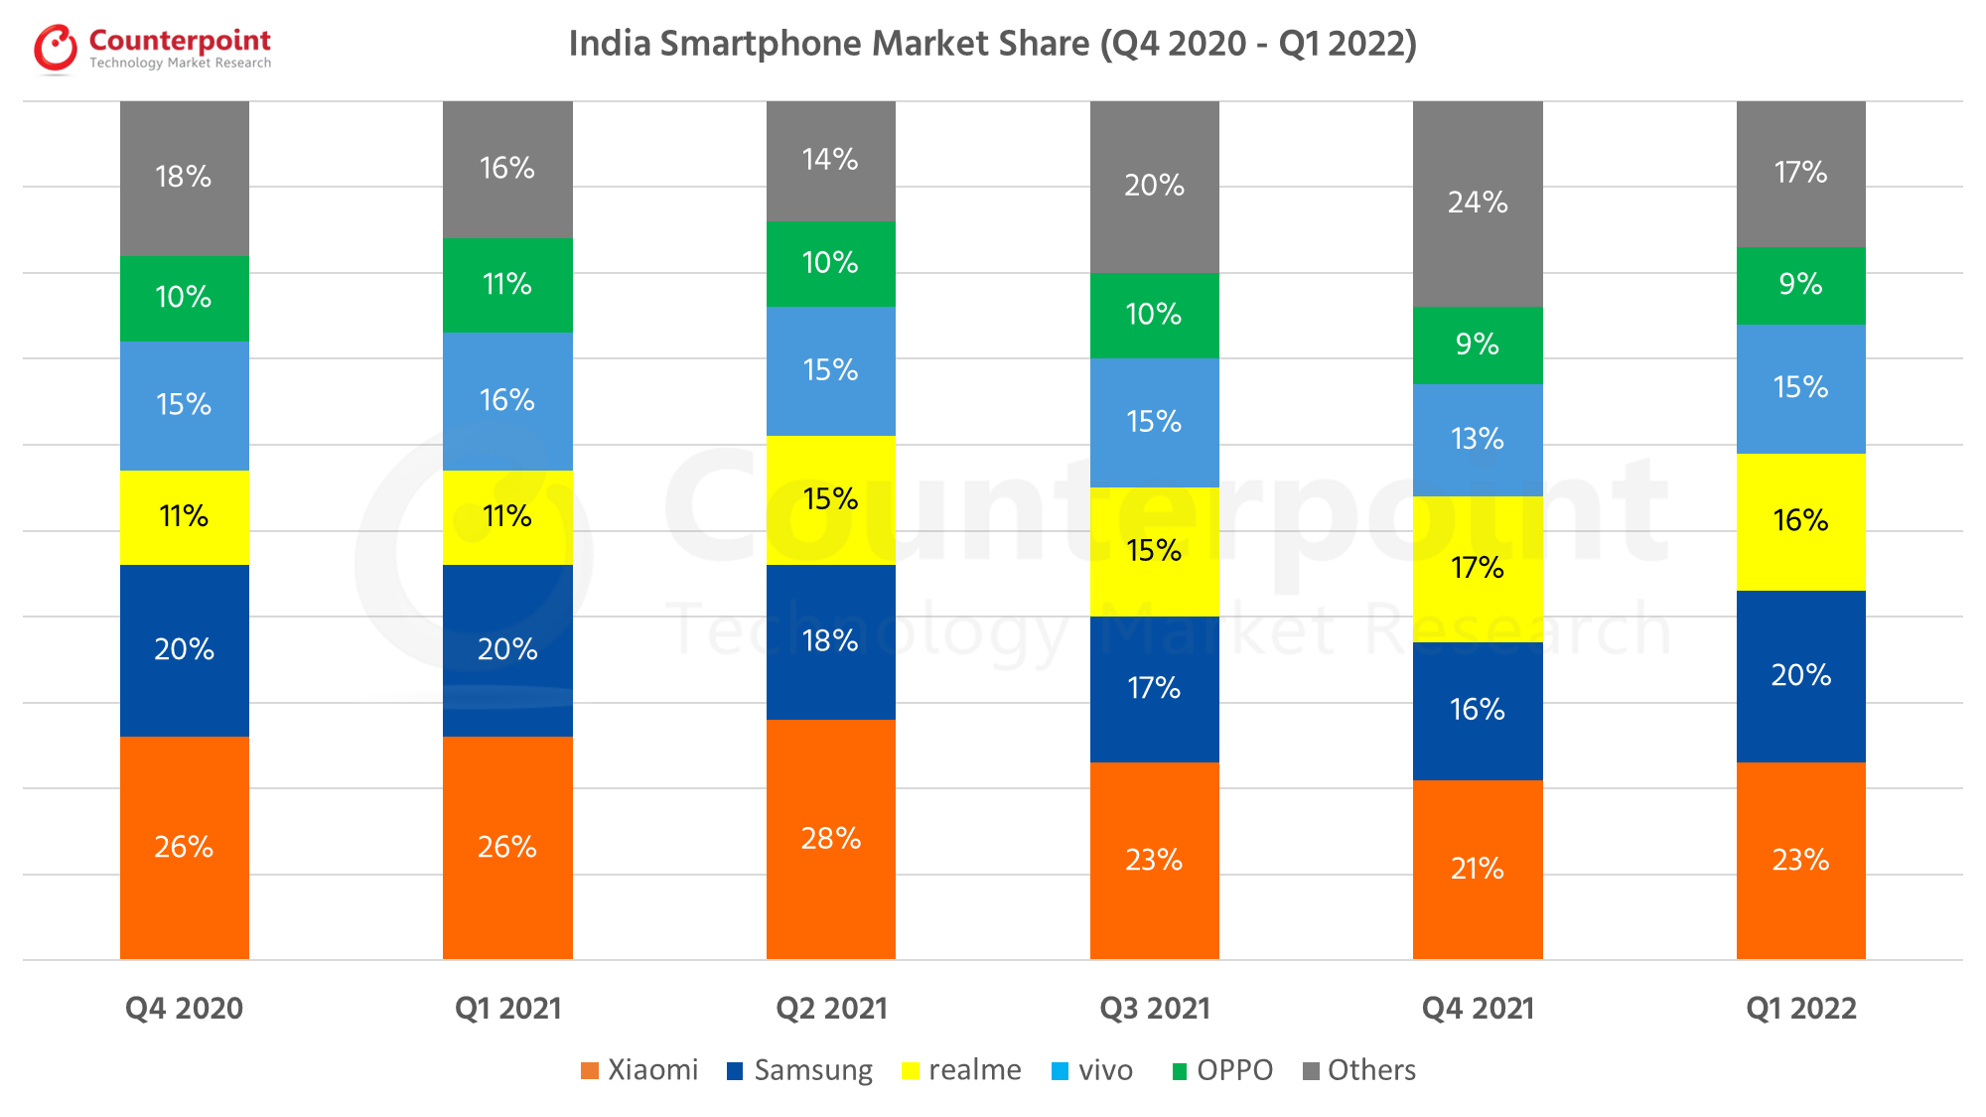
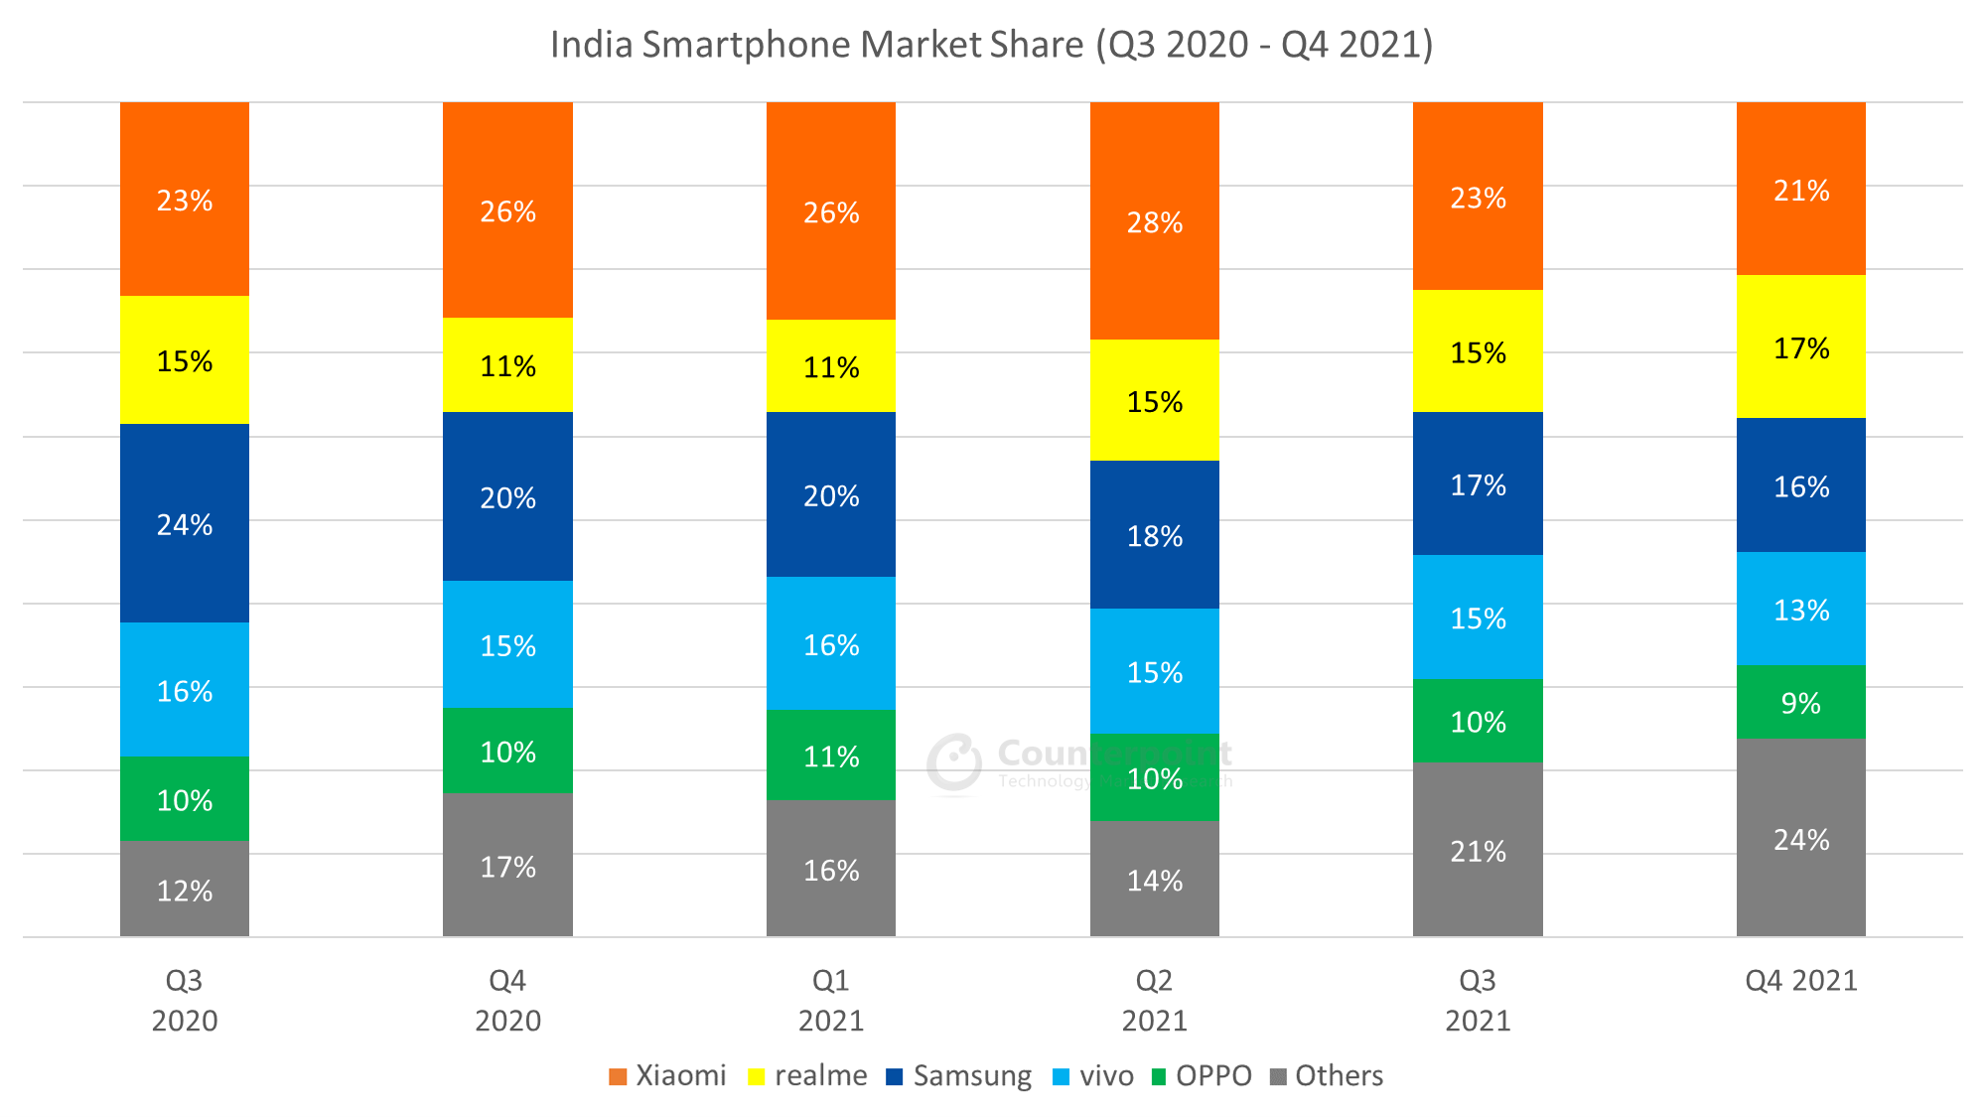
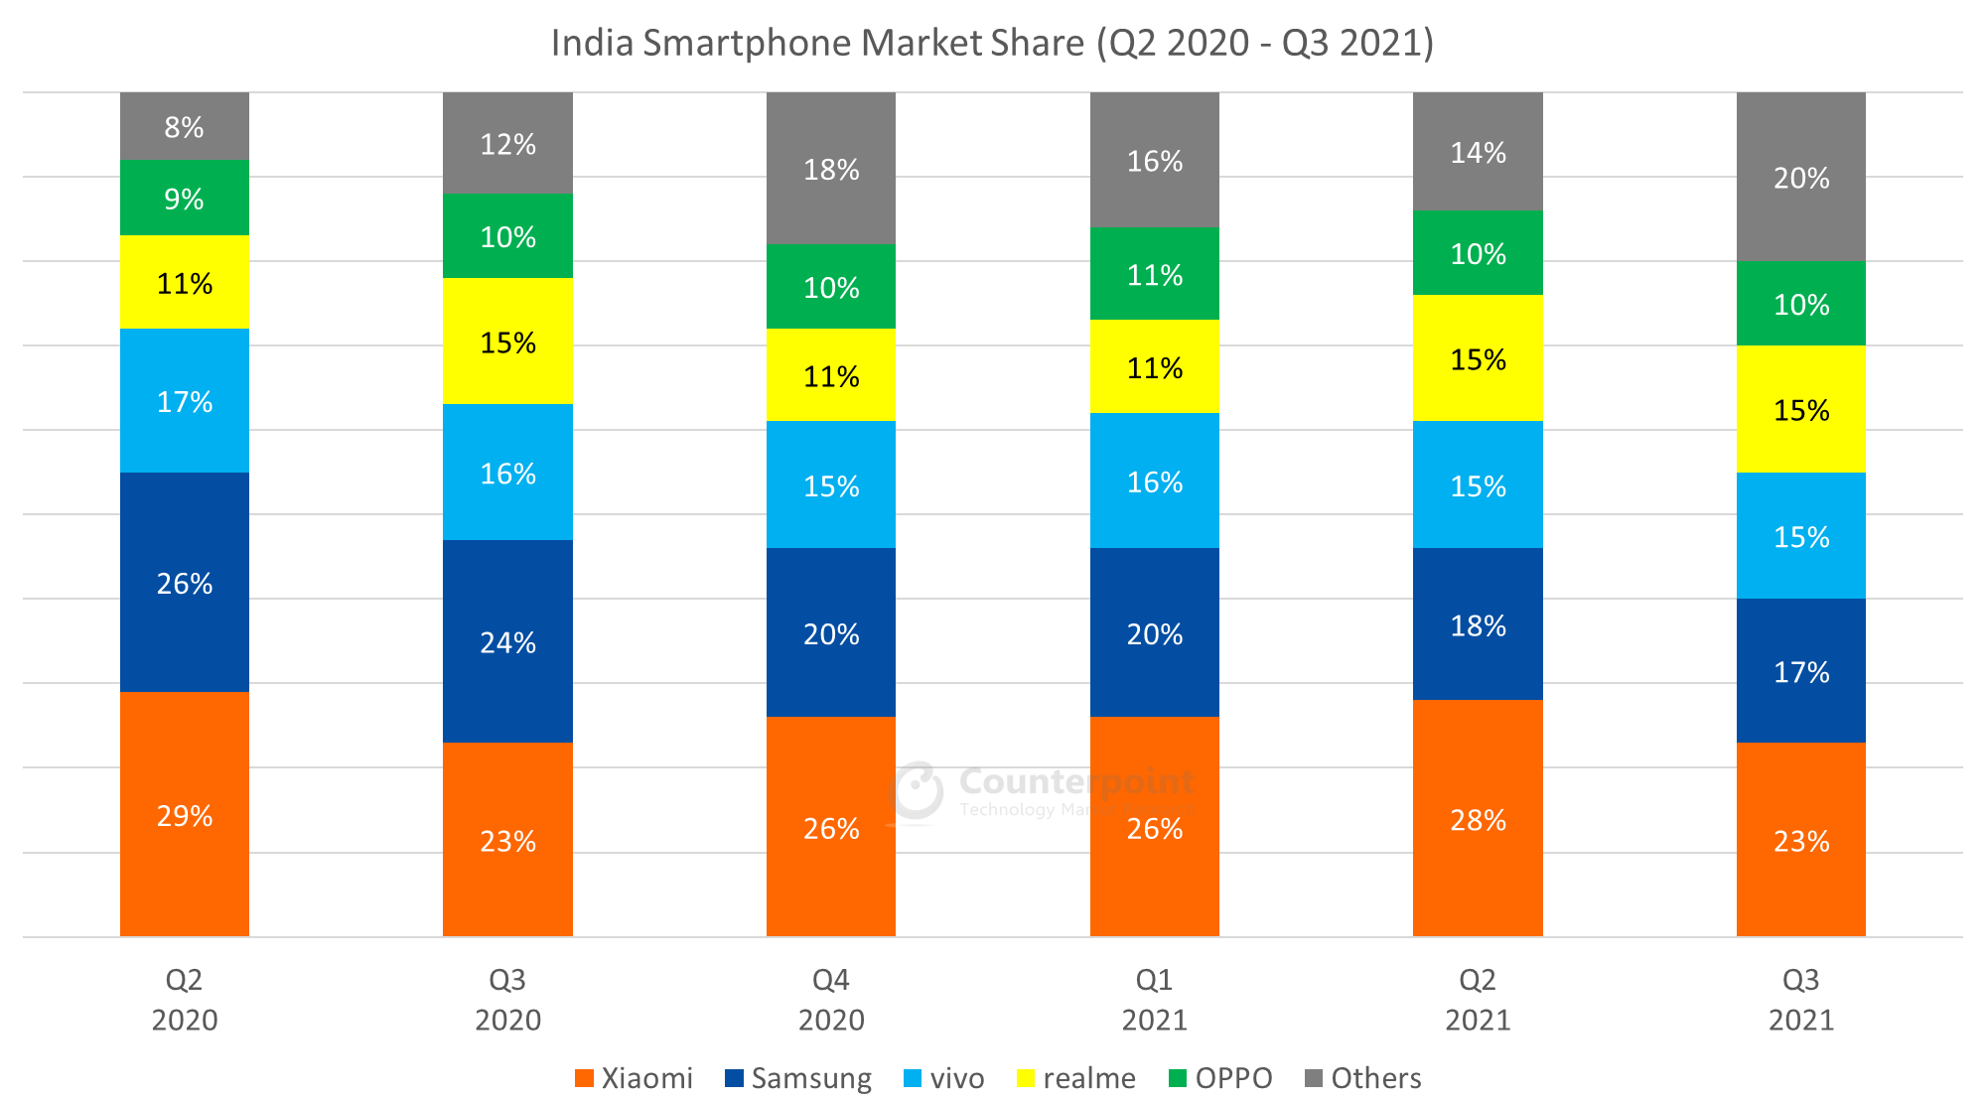
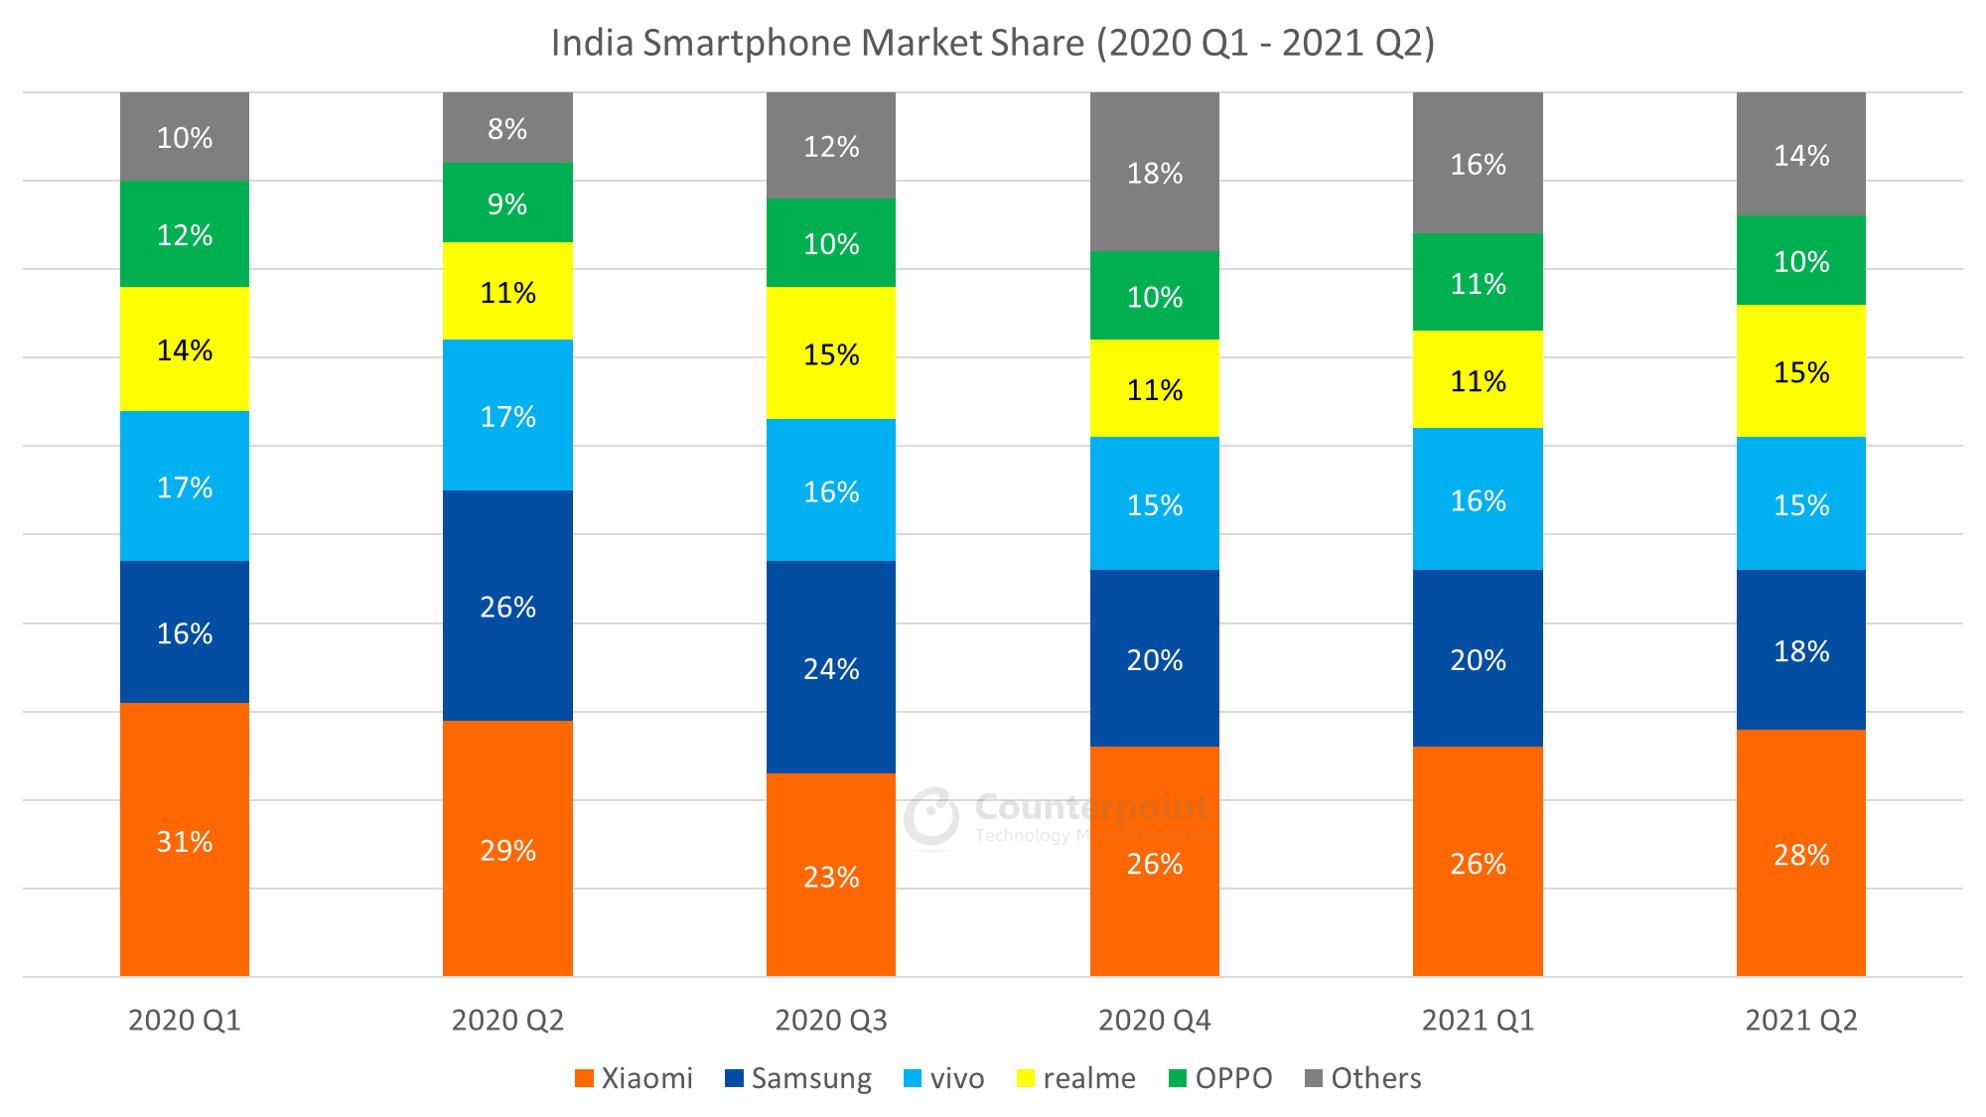
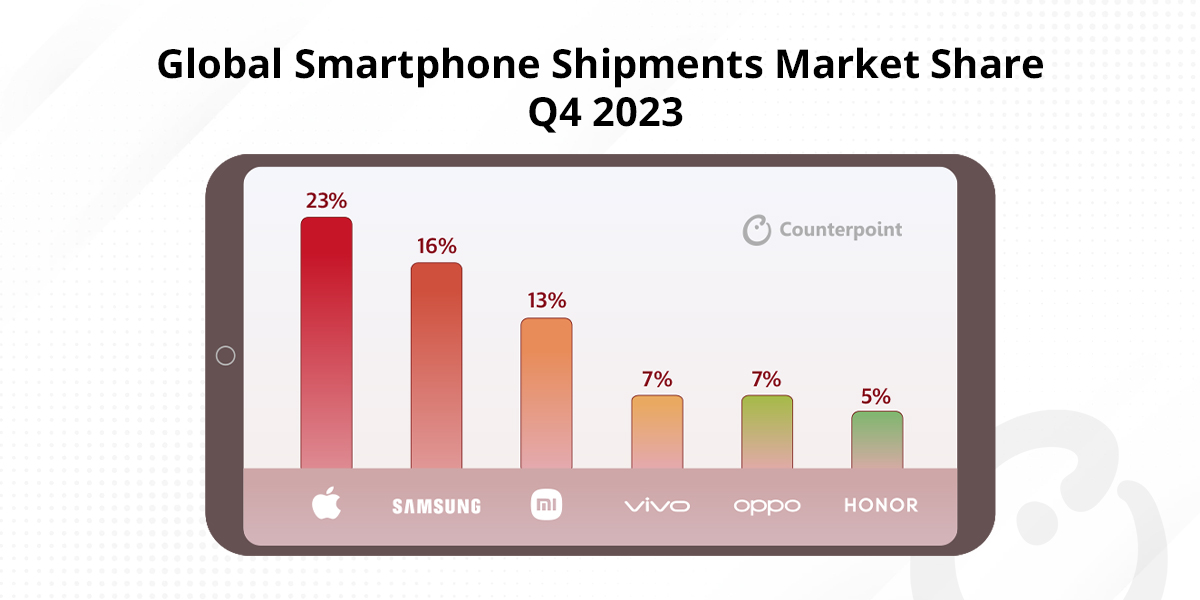
• With a 17.2% share, Samsung remained the market leader for the fourth consecutive quarter.
• Experiencing a high-growth phase in India, Apple recorded 34% YoY growth. Q3 2023 also marked the best quarter for Apple’s shipments in the country, which crossed 2.5 million units.
• vivo was the fastest growing brand among the top five, registering 11% YoY growth
• In Q3 2023, OEMs focussed on launching new devices and filling in channels to prepare for the festive season ahead.
Click here to read about India smartphone market in Q3 2023.
| Brands | Q2 2022 | Q3 2022 | Q4 2022 | Q1 2023 | Q2 2023 | Q3 2023 |
|---|---|---|---|---|---|---|
| Samsung | 18% | 19% | 20% | 20% | 18% | 17% |
| Xiaomi | 19% | 21% | 18% | 16% | 15% | 17% |
| vivo | 17% | 14% | 18% | 17% | 17% | 16% |
| realme | 16% | 14% | 8% | 9% | 12% | 14% |
| OPPO | 11% | 10% | 11% | 12% | 11% | 10% |
| Others | 19% | 22% | 25% | 26% | 27% | 26% |
*Ranking is according to the latest quarter.
Published Date: Aug 17, 2023
Market Highlights
• India’s smartphone shipments declined 3% YoY in Q2 2023 (April-July). Though it was the fourth consecutive declining quarter, the magnitude of the decline reduced considerably.
• 5G smartphones’ contribution to total smartphone shipments reached a record of 50%.
• With an 18% share, Samsung led India’s smartphone market for the third consecutive quarter. It was also the top 5G brand.
• vivo maintained its second position. It was the only brand among the top five to experience YoY growth.
• Samsung surpassed Apple to become the top premium segment (>INR 30,000 or ~ $366) brand. Apple continued to lead the ultra-premium segment (>INR 45,000 or ~$549) with a 59% share.
• OnePlus was the fastest growing brand with 68% YoY growth, followed by Apple with 56% YoY growth.
Click here to read about India smartphone market in Q2 2023.
| Brands | Q1 2022 | Q2 2022 | Q3 2022 | Q4 2022 | Q1 2023 | Q2 2023 |
|---|---|---|---|---|---|---|
| Samsung | 20% | 18% | 19% | 20% | 20% | 18% |
| vivo | 15% | 17% | 14% | 18% | 17% | 17% |
| Xiaomi | 23% | 19% | 21% | 18% | 16% | 15% |
| realme | 16% | 16% | 14% | 8% | 9% | 12% |
| OPPO | 9% | 11% | 10% | 11% | 12% | 11% |
| Others | 17% | 19% | 22% | 25% | 26% | 27% |
*Ranking is according to the latest quarter.
Market Highlights
• Q1 2023 (January-March) was the third consecutive quarter to see a decline in India’s smartphone shipments.
• 5G smartphones’ contribution to total smartphone shipments reached a record of 43%.
• With a 20% share, Samsung led the Indian smartphone market for the second consecutive quarter. It was also the top 5G brand.
• vivo captured the second spot and became the leading brand in the affordable premium segment (INR 30,000-INR 45,000, ~$370-$550)
• Apple continued to lead the premium and ultra-premium segments, with strong growth in offline channels.
• OnePlus was the fastest growing brand, followed by Apple. 5G smartphones in India captured a 32% share in 2022. Samsung became the top-selling 5G brand in 2022 with a 21% share.
Click here to read about India smartphone market in Q1 2023.
| Brands | Q4 2021 | Q1 2022 | Q2 2022 | Q3 2022 | Q4 2022 | Q1 2023 |
|---|---|---|---|---|---|---|
| Samsung | 16% | 20% | 18% | 19% | 20% | 20% |
| vivo | 13% | 15% | 17% | 14% | 18% | 17% |
| Xiaomi | 21% | 23% | 19% | 21% | 18% | 16% |
| OPPO | 9% | 9% | 11% | 10% | 11% | 12% |
| realme | 17% | 16% | 16% | 14% | 8% | 9% |
| Others | 24% | 17% | 19% | 22% | 25% | 26% |
*Ranking is according to the latest quarter.
Click here to read about India smartphone market in Q4 2022.
| India Smartphone Market Share (%) | ||||||
| Brands | Q3 2021 | Q4 2021 | Q1 2022 | Q2 2022 | Q3 2022 | Q4 2022 |
| Samsung | 17% | 16% | 20% | 18% | 19% | 20% |
| Xiaomi | 23% | 21% | 23% | 19% | 21% | 18% |
| vivo | 15% | 13% | 15% | 17% | 14% | 18% |
| OPPO | 10% | 9% | 9% | 11% | 10% | 11% |
| realme | 15% | 17% | 16% | 16% | 14% | 8% |
| Others | 20% | 24% | 17% | 19% | 22% | 25% |
*Ranking is according to the latest quarter.
Click here to read about India smartphone market in Q3 2022.
| Brands | Q2 2021 | Q3 2021 | Q4 2021 | Q1 2022 | Q2 2022 | Q3 2022 |
| Xiaomi | 28% | 23% | 21% | 23% | 19% | 21% |
| Samsung | 18% | 17% | 16% | 20% | 18% | 19% |
| realme | 15% | 15% | 17% | 16% | 16% | 14% |
| vivo | 15% | 15% | 13% | 15% | 17% | 14% |
| OPPO | 10% | 10% | 9% | 9% | 11% | 10% |
| Others | 14% | 20% | 24% | 17% | 19% | 22% |
*Ranking is according to the latest quarter.
Click here to read about India smartphone market in Q2 2022.
| Brands | Q1 2021 | Q2 2021 | Q3 2021 | Q4 2021 | Q1 2022 | Q2 2022 |
| Xiaomi | 26% | 28% | 23% | 21% | 23% | 19% |
| Samsung | 20% | 18% | 17% | 16% | 20% | 19% |
| vivo | 16% | 15% | 15% | 13% | 15% | 17% |
| realme | 11% | 15% | 15% | 17% | 16% | 16% |
| OPPO | 11% | 10% | 10% | 9% | 9% | 11% |
| Others | 16% | 14% | 20% | 24% | 17% | 18% |
*Ranking is according to the latest quarter.
Market Highlights
Click here to read about India smartphone market in Q1 2022.
| Brands | Q4 2020 | Q1 2021 | Q2 2021 | Q3 2021 | Q4 2021 | Q1 2022 |
| Xiaomi | 26% | 26% | 28% | 23% | 21% | 23% |
| Samsung | 20% | 20% | 18% | 17% | 16% | 20% |
| realme | 11% | 11% | 15% | 15% | 17% | 16% |
| vivo | 15% | 16% | 15% | 15% | 13% | 15% |
| OPPO | 10% | 11% | 10% | 10% | 9% | 9% |
| Others | 18% | 16% | 14% | 20% | 24% | 17% |
**Ranking is according to the latest quarter.
Market Highlights
| Brands | Q3 2020 | Q4 2020 | Q1 2021 | Q2 2021 | Q3 2021 | Q4 2021 |
| Xiaomi | 23% | 26% | 26% | 28% | 23% | 21% |
| realme | 15% | 11% | 11% | 15% | 15% | 17% |
| Samsung | 24% | 20% | 20% | 18% | 17% | 16% |
| vivo | 16% | 15% | 16% | 15% | 15% | 13% |
| OPPO | 10% | 10% | 11% | 10% | 10% | 9% |
| Others | 12% | 17% | 16% | 14% | 21% | 24% |
*Ranking is according to the latest quarter.
Market Highlights
| Brands | Q2 2020 | Q3 2020 | Q4 2020 | Q1 2021 | Q2 2021 | Q3 2021 |
| Xiaomi | 29% | 23% | 26% | 26% | 28% | 23% |
| Samsung | 26% | 24% | 20% | 20% | 18% | 17% |
| vivo | 17% | 16% | 15% | 16% | 15% | 15% |
| realme | 11% | 15% | 11% | 11% | 15% | 15% |
| OPPO | 9% | 10% | 10% | 11% | 10% | 10% |
| Others | 8% | 12% | 18% | 16% | 14% | 20% |
*Ranking is according to the latest quarter.
Market Highlights
| Brands | 2020 Q1 | 2020 Q2 | 2020 Q3 | 2020 Q4 | 2021 Q1 | 2021 Q2 |
| Xiaomi | 31% | 29% | 23% | 26% | 26% | 28% |
| Samsung | 16% | 26% | 24% | 20% | 20% | 18% |
| vivo | 17% | 17% | 16% | 15% | 16% | 15% |
| realme | 14% | 11% | 15% | 11% | 11% | 15% |
| OPPO | 12% | 9% | 10% | 10% | 11% | 10% |
| Others | 10% | 8% | 12% | 18% | 16% | 14% |
*Ranking is according to the latest quarter.
Market Highlights
| Brands | 2019 Q4 | 2020 Q1 | 2020 Q2 | 2020 Q3 | 2020 Q4 | 2021 Q1 |
| Xiaomi | 27% | 31% | 29% | 23% | 26% | 26% |
| Samsung | 18% | 16% | 26% | 24% | 20% | 20% |
| vivo | 21% | 17% | 17% | 16% | 15% | 16% |
| Realme | 8% | 14% | 11% | 15% | 11% | 11% |
| Oppo | 12% | 12% | 9% | 10% | 10% | 11% |
| Others | 14% | 10% | 8% | 12% | 18% | 16% |
*Ranking is according to the latest quarter.
Market Highlights
| Brands | 2019 Q3 | 2019 Q4 | 2020 Q1 | 2020 Q2 | 2020 Q3 | 2020 Q4 |
| Xiaomi | 26% | 27% | 30% | 29% | 23% | 26% |
| Samsung | 20% | 18% | 16% | 26% | 24% | 19% |
| vivo | 17% | 21% | 17% | 17% | 16% | 15% |
| Realme | 16% | 8% | 14% | 11% | 15% | 12% |
| Oppo | 8% | 12% | 12% | 9% | 10% | 10% |
| Others | 13% | 14% | 11% | 8% | 12% | 18% |
*Ranking is according to the latest quarter.
Market Highlights
| Brands | 2019 Q2 | 2019 Q3 | 2019 Q4 | 2020 Q1 | 2020 Q2 | 2020 Q3 |
| Samsung | 25% | 20% | 18% | 16% | 26% | 24% |
| Xiaomi | 28% | 26% | 27% | 30% | 29% | 23% |
| Vivo | 11% | 17% | 21% | 17% | 17% | 16% |
| Realme | 9% | 16% | 8% | 14% | 11% | 15% |
| Oppo | 8% | 8% | 12% | 12% | 9% | 10% |
| Others | 19% | 13% | 14% | 11% | 8% | 12% |
*Ranking is according to the latest quarter.
Market Highlights
| Brands | 2019Q1 | 2019Q2 | 2019Q3 | 2019Q4 | 2020Q1 | 2020Q2 |
| Xiaomi | 29% | 28% | 26% | 27% | 30% | 29% |
| Samsung | 23% | 25% | 20% | 18% | 16% | 26% |
| Vivo | 12% | 11% | 17% | 21% | 17% | 17% |
| Realme | 7% | 9% | 16% | 8% | 14% | 11% |
| Oppo | 7% | 8% | 8% | 12% | 12% | 9% |
| Others | 22% | 19% | 13% | 14% | 11% | 8% |
*Ranking is according to the latest quarter.
Market Highlights
| Brands | 2019 Q1 | 2019 Q2 | 2019 Q3 | 2019 Q4 | 2020 Q1 |
| Xiaomi | 29% | 28% | 26% | 27% | 30% |
| Vivo | 12% | 11% | 17% | 21% | 17% |
| Samsung | 23% | 25% | 20% | 18% | 16% |
| Realme | 7% | 9% | 16% | 8% | 14% |
| Oppo | 7% | 8% | 8% | 12% | 12% |
| Others | 22% | 19% | 13% | 14% | 11% |
*Ranking is according to the latest quarter.
Market Highlights
| India Smartphone Market Share (%) | 2018 Q4 | 2019 Q1 | 2019 Q2 | 2019 Q3 | 2019 Q4 |
| Xiaomi | 27% | 29% | 28% | 26% | 27% |
| Vivo | 10% | 12% | 12% | 17% | 21% |
| Samsung | 20% | 24% | 25% | 20% | 19% |
| Oppo | 7% | 7% | 8% | 8% | 12% |
| Realme | 8% | 7% | 9% | 16% | 8% |
| Others | 28% | 21% | 18% | 13% | 13% |
*Ranking is according to the latest quarter.
Market Highlights
| Brands | 2018 Q3 | 2018 Q4 | 2019 Q1 | 2019 Q2 | 2019 Q3 |
| Xiaomi | 27% | 27% | 29% | 28% | 26% |
| Samsung | 23% | 20% | 24% | 25% | 20% |
| Vivo | 10% | 10% | 12% | 12% | 17% |
| Realme | 3% | 8% | 7% | 9% | 16% |
| Oppo | 8% | 7% | 7% | 8% | 8% |
| Others | 29% | 28% | 21% | 18% | 13% |
*Ranking is according to the latest quarter.
Market Highlights
| Brands | 2018 Q2 | 2018 Q3 | 2018 Q4 | 2019 Q1 | 2019 Q2 |
| Xiaomi | 28% | 27% | 27% | 29% | 28% |
| Samsung | 28% | 23% | 20% | 24% | 25% |
| Vivo | 12% | 10% | 10% | 12% | 12% |
| Realme | 1% | 3% | 8% | 7% | 9% |
| Oppo | 9% | 8% | 7% | 7% | 8% |
| Others | 22% | 29% | 28% | 21% | 18% |
*Ranking is according to the latest quarter.
Market Highlights
| Brands | 2018Q1 | 2018Q2 | 2018Q3 | 2018Q4 | 2019Q1 |
| Xiaomi | 31% | 28% | 27% | 27% | 29% |
| Samsung | 26% | 28% | 23% | 20% | 24% |
| vivo | 6% | 12% | 10% | 10% | 12% |
| Realme | – | 1% | 3% | 8% | 7% |
| Oppo | 6% | 9% | 8% | 7% | 7% |
| Others | 31% | 22% | 29% | 28% | 21% |
*Ranking is according to the latest quarter.
Market Highlights
| Brands | 2017Q4 | 2018Q1 | 2018Q2 | 2018Q3 | 2018Q4 |
| Xiaomi | 25% | 31% | 28% | 27% | 27% |
| Samsung | 23% | 26% | 28% | 23% | 20% |
| vivo | 6% | 6% | 12% | 10% | 10% |
| Oppo | 6% | 6% | 9% | 8% | 7% |
| Micromax | 5% | 3% | 1% | 9% | 5% |
| Others | 35% | 28% | 22% | 23% | 31% |
**Ranking is according to the latest quarter.
Market Highlights
| Brands | 2017Q3 | 2017Q4 | 2018Q1 | 2018Q2 | 2018Q3 |
| Xiaomi | 22% | 25% | 31% | 28% | 27% |
| Samsung | 23% | 23% | 26% | 28% | 23% |
| vivo | 9% | 6% | 6% | 12% | 10% |
| Micromax | 6% | 5% | 3% | 1% | 9% |
| Oppo | 8% | 6% | 6% | 9% | 8% |
| Others | 32% | 35% | 28% | 22% | 23% |
*Ranking is according to the latest quarter.
Market Highlights
| Brands | 2017Q2 | 2017Q3 | 2017Q4 | 2018Q1 | 2018Q2 |
| Samsung | 23% | 23% | 23% | 26% | 28% |
| Xiaomi | 16% | 22% | 25% | 31% | 28% |
| vivo | 13% | 9% | 6% | 6% | 12% |
| Oppo | 10% | 8% | 6% | 6% | 9% |
| Huawei | 1% | 1% | 1% | 3% | 3% |
| Others | 37% | 37% | 39% | 28% | 20% |
*Ranking is according to the latest quarter.
Market Highlights
| Brands | 2017Q1 | 2017Q2 | 2017Q3 | 2017Q4 | 2018Q1 |
| Xiaomi | 13% | 16% | 22% | 25% | 31% |
| Samsung | 27% | 23% | 23% | 23% | 26% |
| vivo | 12% | 13% | 9% | 6% | 6% |
| Oppo | 10% | 10% | 8% | 6% | 6% |
| Huawei | 1% | 1% | 1% | 1% | 3% |
| Others | 37% | 37% | 37% | 39% | 28% |
*Ranking is according to the latest quarter.
Copyright ⓒ Counterpoint Technology Market Research | All rights reserved