Analyse quarterly data on iOS vs. Android market share for global and regional markets like the US, China, and India.
Published Date: Feb 23, 2024
Receive quarterly updates in your email
Market Highlights
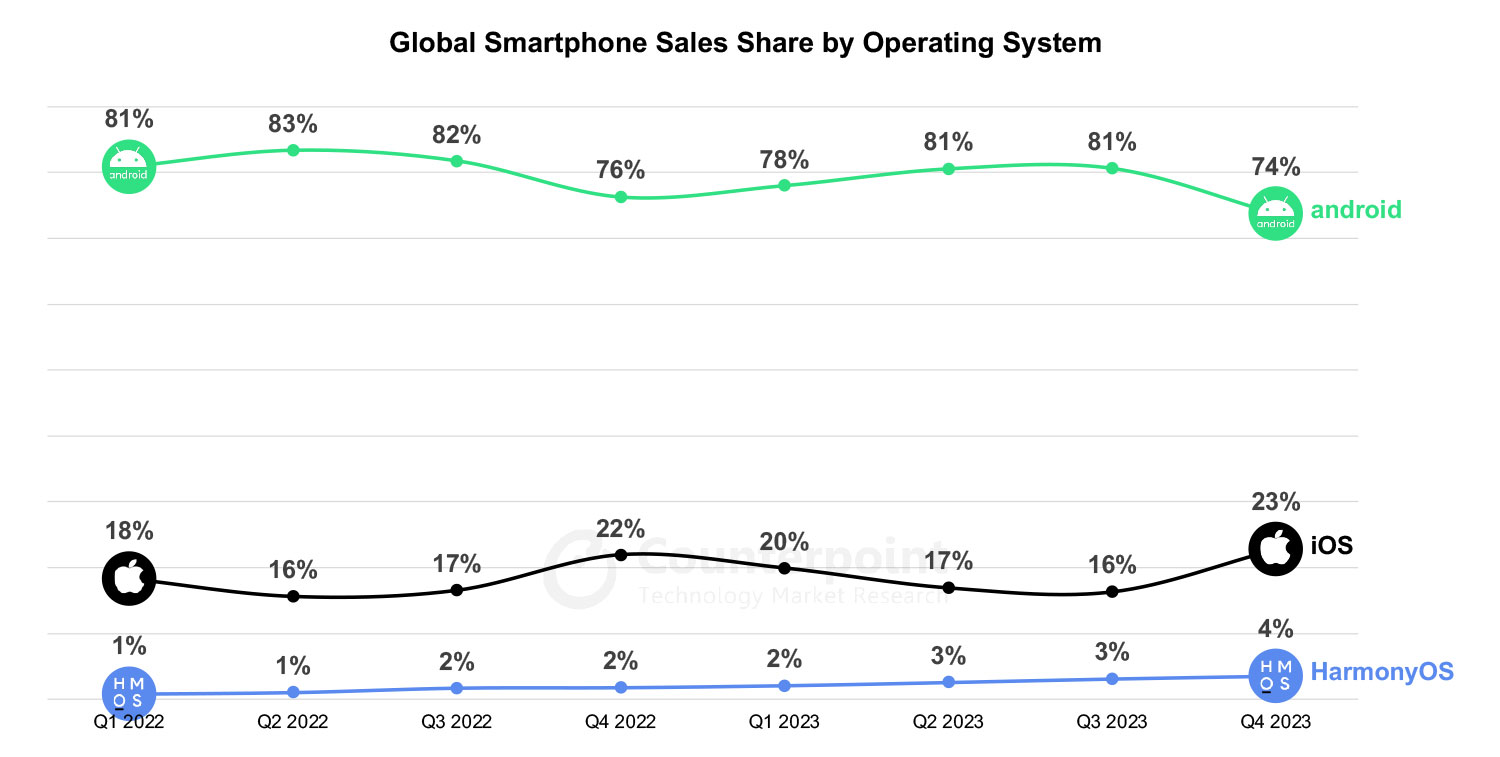
The global smartphone OS witnessed historic highs and lows in Q4 2023. While iOS and Harmony reached their highest ever global market share at 23% and 4% respectively, Android touched its lowest at 74%. Increasing premiumisation and consumer switch from Android helped iOS whereas 5G smartphones from Huawei sped up to Harmony's growth in China.
Android maintained its dominance globally and smartphone growth in developing markets like MEA helped mitigate its decline. The OS maintains lead across price band under $600 and is the only open-source OS among its competitors becoming the go-to option for several OEMS. Android customization also allows OEMs to showcase their own versions of the OS.
iOS reached its highest quarterly share ever driven by Apple registering all-time high revenues across regions. Apple has been the primary benefactor of customers switching to premium smartphones globally aided by easy financing schemes facilitating growth of first-time users. Its ecosystem has allowed for the OS to be popular among younger customers as well.
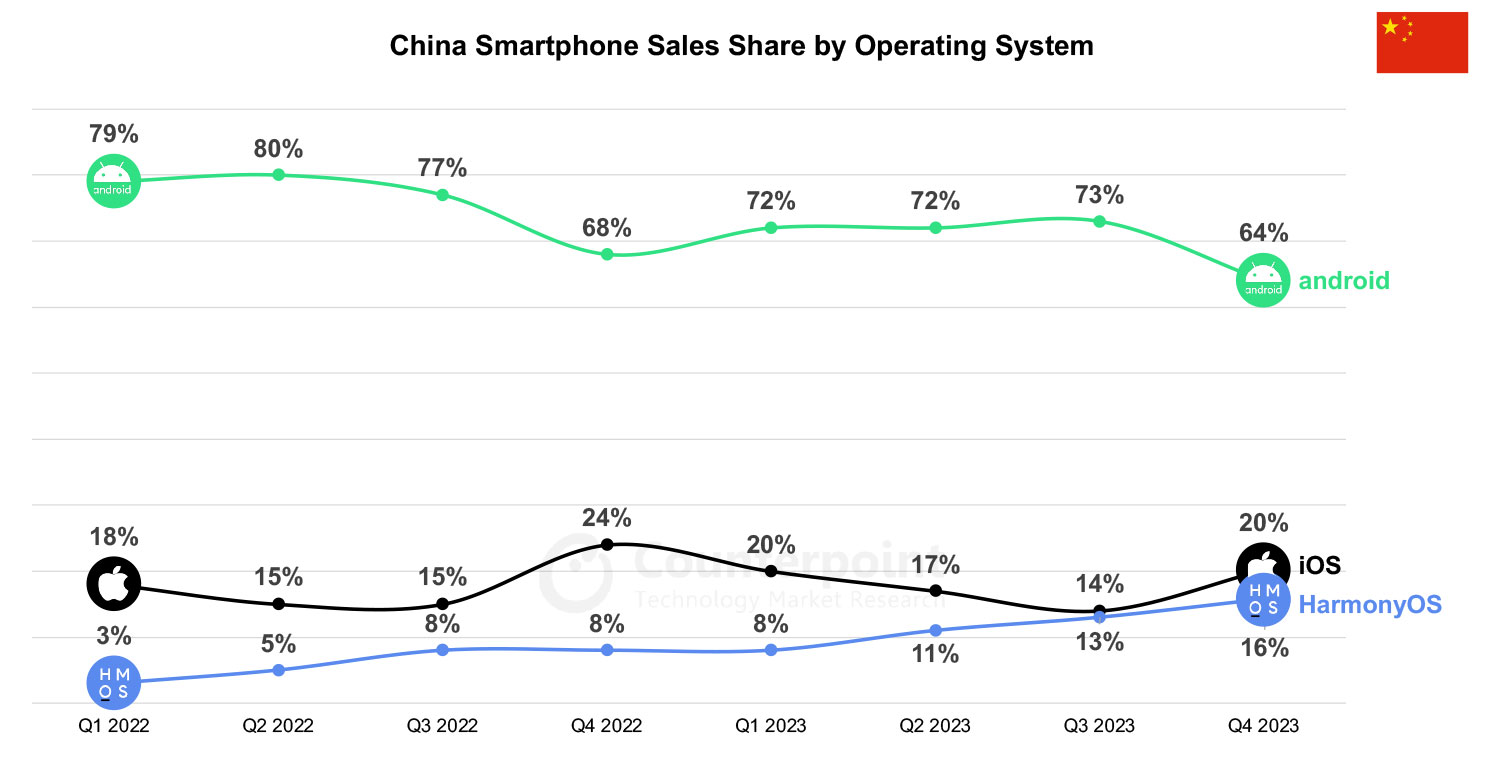
Harmony OS reached 4% global market and crossed 16% market share in China. The OS, driven by Huawei smartphones, registered high growth with introduction of 5G smartphones from the brand. Over 40% Harmony OS smartphone were 5G capable in Q4 2023 up from 7% in Q4 2022.
| Global Share | Q1 2022 | Q2 2022 | Q3 2022 | Q4 2022 | Q1 2023 | Q2 2023 | Q3 2023 | Q4 2023 |
|---|---|---|---|---|---|---|---|---|
| Android | 81% | 83% | 82% | 76% | 78% | 81% | 81% | 74% |
| iOS | 18% | 16% | 17% | 22% | 20% | 17% | 16% | 23% |
| Harmony | 1% | 1% | 2% | 2% | 2% | 3% | 3% | 4% |
| Total | 100% | 100% | 100% | 100% | 100% | 100% | 100% | 100% |
China Market
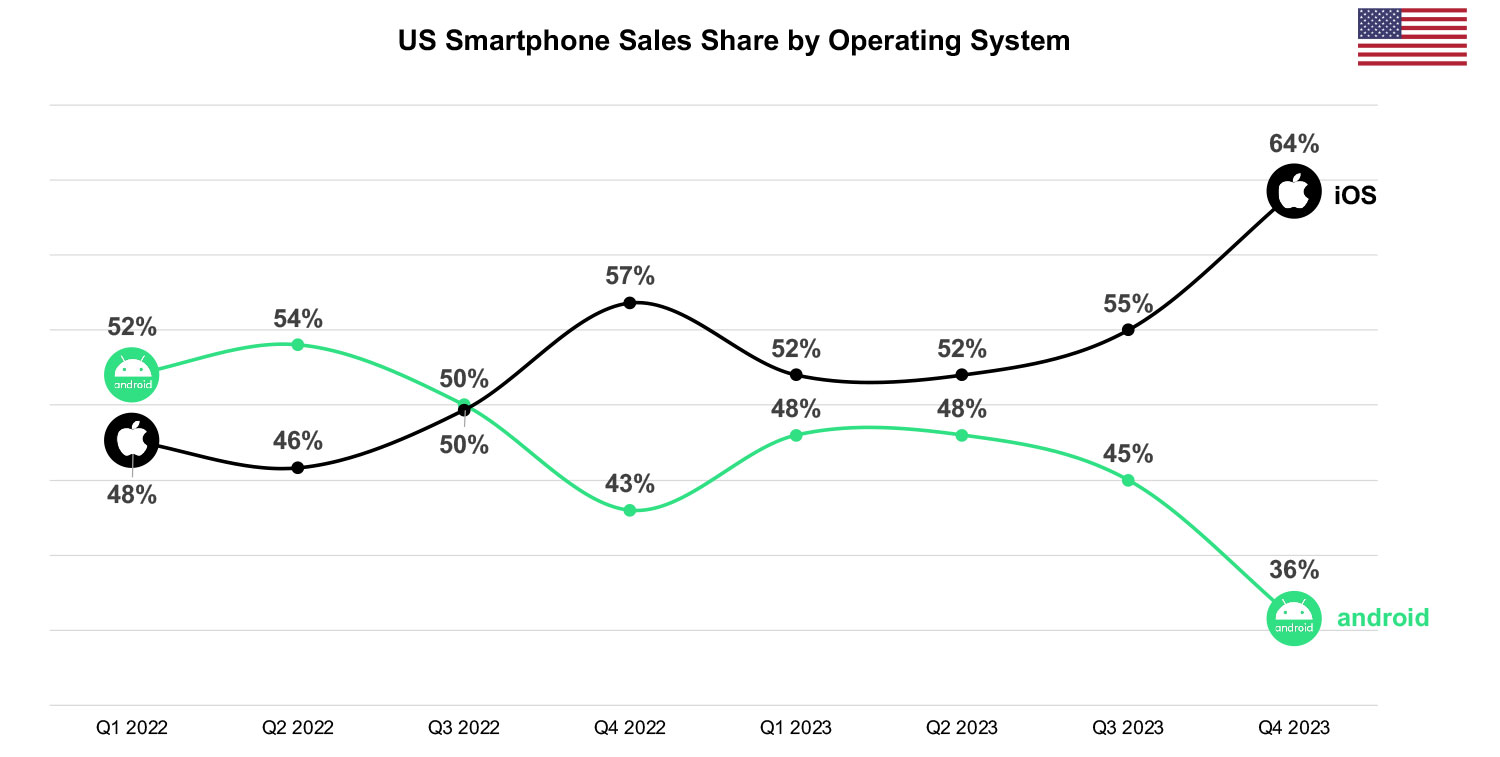
| USA Share | Q1 2022 | Q2 2022 | Q3 2022 | Q4 2022 | Q1 2023 | Q2 2023 | Q3 2023 | Q4 2023 |
|---|---|---|---|---|---|---|---|---|
| Android | 52% | 54% | 50% | 43% | 48% | 48% | 45% | 36% |
| iOS | 48% | 46% | 50% | 57% | 52% | 52% | 55% | 64% |
| Total | 100% | 100% | 100% | 100% | 100% | 100% | 100% | 100% |
| China Share | Q1 2022 | Q2 2022 | Q3 2022 | Q4 2022 | Q1 2023 | Q2 2023 | Q3 2023 | Q4 2023 |
|---|---|---|---|---|---|---|---|---|
| Android | 79% | 80% | 77% | 68% | 72% | 72% | 73% | 64% |
| iOS | 18% | 15% | 15% | 24% | 20% | 17% | 14% | 20% |
| Harmony | 3% | 5% | 8% | 8% | 8% | 11% | 13% | 16% |
| Total | 100% | 100% | 100% | 100% | 100% | 100% | 100% | 100% |
| India Share | Q1 2022 | Q2 2022 | Q3 2022 | Q4 2022 | Q1 2023 | Q2 2023 | Q3 2023 | Q4 2023 |
|---|---|---|---|---|---|---|---|---|
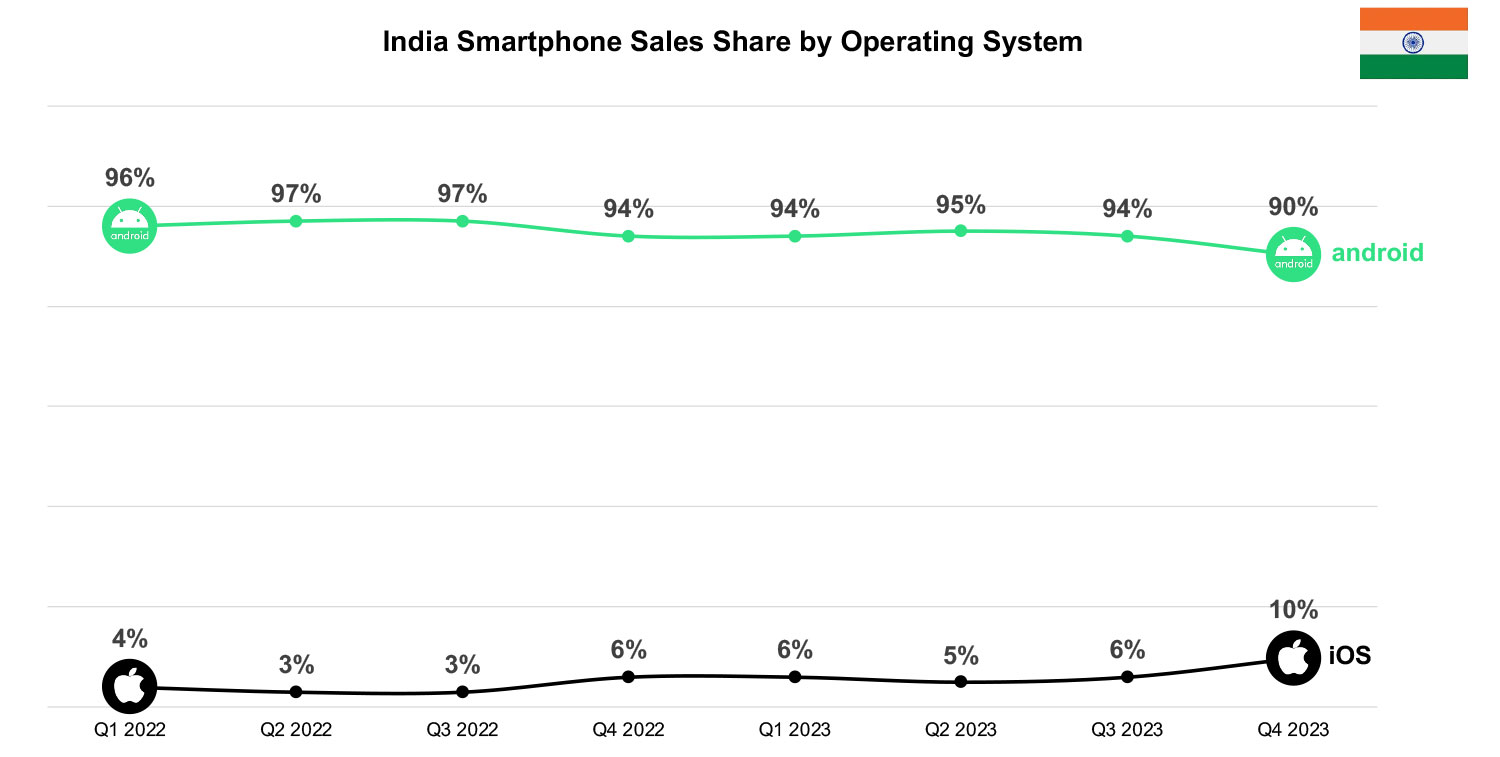
| Android | 96% | 97% | 97% | 94% | 94% | 95% | 94% | 90% |
| iOS | 4% | 3% | 3% | 6% | 6% | 5% | 6% | 10% |
| Total | 100% | 100% | 100% | 100% | 100% | 100% | 100% | 100% |
*Ranking is according to the latest quarter.
This page presents quarterly insights into the worldwide smartphone OS scenario, featuring country-specific breakdowns for Android, iOS, and HarmonyOS, specifically focusing on the US, China, and India.
This data is a part of a series of reports which provide an insightful view of the changing trends in smartphone components and driving factors in the various price segments. It covers 99% of the global handset market with specification analysis.
For detailed insights on the data, please reach out to us at sales(at)counterpointresearch.com. If you are a member of the press, please contact us at press(at)counterpointresearch.com for any media enquiries.

The global smartphone market share numbers are from:
XLS File
Published Date: November 2023
This report tracks quarterly global handset model sales data by OEM with the key specifications. This report gives an insightful view of the changing trends in smartphone components and driving factors in the various price segments. It covers 99% of the global handset market with specification analysis.
Recommended Reads:
Copyright ⓒ Counterpoint Technology Market Research | All rights reserved